


Abstract
Aims
Rheumatoid arthritis (RA) is a systematic autoimmune disorder, characterized by synovial inflammation, bone and cartilage destruction, and disease involvement in multiple organs. Although numerous drugs are employed in RA treatment, some respond little and suffer from severe side effects. This study aimed to screen the candidate therapeutic targets and promising drugs in a novel method.
Methods
We developed a module-based and cumulatively scoring approach that is a deeper-layer application of weighted gene co-expression network (WGCNA) and connectivity map (CMap) based on the high-throughput datasets.
Results
Four noteworthy RA-related modules were identified, revealing the immune- and infection-related biological processes and pathways involved in RA. HLA-DMA, HLA-DMB, HLA-DPA1, HLA-DPB1, HLA-DQB1, HLA-DRA, HLA-DRB1, BLNK, BTK, CD3D, CD4, IL2RG, INPP5D, LCK, PTPRC, RAC2, SYK, and VAV1 were recognized as the key hub genes with high connectivity in gene regulation networks and gene pathway networks. Moreover, the long noncoding RNAs (lncRNAs) in the RA-related modules, such as FAM30A and NEAT1, were identified as the indispensable interactors with the hub genes. Finally, candidate drugs were screened by developing a cumulatively scoring approach based on the selected modules. Niclosamide and the other compounds of T-type calcium channel blocker, IKK inhibitor, and PKC activator, HIF activator, and proteasome inhibitor, which harbour the similar gene signature with niclosamide, were promising drugs with high specificity and broad coverage for the RA-related modules.
Conclusion
This study provides not only the promising targets and drugs for RA but also a novel methodological insight into the target and drug screening.
Cite this article: Bone Joint Res 2020;9(8):501–514.
Article focus
-
Some drugs are employed in rheumatoid arthritis (RA) treatment, however some patients respond little and suffer from severe side effects.
-
This study is aimed to screen the candidate targets and promising drugs in a novel method.
Key messages
-
Four noteworthy RA-related modules were identified, suggesting the immune- and infection-related biological processes and pathways involved in RA.
-
HLA-DMA, HLA-DMB, HLA-DPA1, HLA-DPB1, HLA-DQB1, HLA-DRA, HLA-DRB1, BLNK, BTK, CD3D, CD4, IL2RG, INPP5D, LCK, PTPRC, RAC2, SYK, and VAV1 were recognized as the key hub genes in RA.
-
Long noncoding RNAs FAM30A and NEAT1 were identified as the indispensable interactors with the identified hub genes.
-
The candidate drugs were screened by developing a cumulatively scoring approach based on the selected modules.
Strengths and limitations
-
This study provides not only the promising targets and drugs for RA but also a novel methodological insight into the target and drug screening.
-
The novel method harbours high specificity and broad coverage for the RA-related modules, providing the promising drugs for clinic use.
-
Functional research of identified RA-related genes and lncRNAs should be further validated and the pharmacological research of screened compounds should be performed.
Introduction
Rheumatoid arthritis (RA) is a chronic systematic inflammatory and autoimmune disorder with approximately 1% prevalence globally,1 characterized by synovial inflammation, bone and cartilage destruction, and disease involvement in multiple organs,2 resulting in joint damage, cardiovascular and pulmonary comorbidity, and malignancy.3 The joint damage is characterized as persistent and symmetrical polyarthritis and synovial inflammation resulting in cartilage and bone erosion and arthrosis deformity. Although the aetiology of RA is still unclear, a complex interaction of genetic and environmental factors such as diet, ethnicity, smoking, and infection is involved in RA.4,5
The treatments of RA are classified into the non-pharmacological treatments and the pharmacological treatments. Non-pharmacological therapy comprises physical and occupational therapy and surgical approaches. Traditional drugs such as glucocorticoids, non-steroidal anti-inflammatory drugs (NSAIDs), and disease-modifying antirheumatic drugs (DMARDs) and new biological drugs including antibodies to pro-inflammatory cytokines (e.g. tumour necrosis factor alpha (TNF-α)) or their receptors (e.g. interelukin (IL)-1, IL-6), or by targeting B-lymphocytes (CD20) or costimulatory molecules (e.g. cytotoxic T-lymphocyte-associated protein 4 (CTLA-4)) are utilized in the treatment of RA.6 However, some patients respond little to the therapy, and side effects can damage the lives of the patients.
An increasing number of studies have screened the potential targets of RA based on the high-throughput methods, such as microarray profiling7 and next-generation sequencing.8 Differentially expressed genes (DEGs) defined by specific thresholds, such as the fold change of gene expression and p-value (e.g. fold change = 2 and p = 0.05), are widely employed in the target screening of RA.9 However, marginally less significant genes (e.g. foldchange = 1.999 or p = 0.051) are missed, resulting in information loss and bias. Moreover, a different threshold was set among studies, resulting in inconsistence of screened targets. Co-expression networks or protein-protein interaction networks constructed by external public databases, such as STRING and BioGRID, are also applied to target screening.10 Due to the ignorance of indirect gene interactions or indeterminacy of public databases based on different algorithms and data sources, the limitation of this method is obvious. To avoid these limitations, Langfelder et al11 developed the weighted gene co-expression network analysis (WGCNA) method, which applies the soft-threshold and considers the indirect interactions between genes, and constructs weighted gene regulation network to find biologically relevant modules and genes. Based on this method, Ma et al12 identified the critical genes in RA such CD97, FYB, and CXCL1.
The connectivity map (CMap) is a useful tool to build the link between disease and compounds by comparing microarray data from more than 1,300 small molecules to the gene signature of the phenotype using a pattern-matching algorithm with a high level of resolution and specificity, which allows for the screening of candidate drugs.13,14 CLUE, the next generation CMap, is a platform for the analysis of perturbational datasets generated using gene expression (L1000) and proteomic (P100 and GCP) assays, which integrate the CMap dataset and provide the useful tool Touchstone (Broad Institute, Cambridge, Massachusetts, USA) to assess and visualize connectivity among perturbagens.15 Touchstone was utilized to investigate the compounds with the similar signature by ranking the median enrichment score (MES) and clustering based on the gene expression signature among multiple types of cell.
Based on the microarray datasets, this study constructed a weighted gene network to identify the significant RA-related modules and genes to investigate the pathogenesis and therapeutic targets. Moreover, we screened promising compounds for the clinical treatment of RA by developing a module-based and cumulatively scoring approach that ensured high specificity and broad coverage for RA-related modules. Our study provides an insight into the novel bioinformatic approach utilized in the target and drug screening for RA.
Methods
Data collection and pre-processing
The datasets GSE55235, GSE55457, and GSE55584 were included by the criteria of “rheumatoid arthritis”, “human”, and “synovial or synovium” and obtained from the National Centre For Biotechnology Information (NCBI) Gene Expression Omnibus (GEO).7 The microarray datasets included in this study are based on the platform of Affymetrix Human Genome U133A Array (HG-U133A), which is designed to analyze the expression level of 18,400 transcripts and variants by a probe hybridization method and composed of more than 22,000 probes. The datasets contain 53 synovial tissues from 33 RA patients and 20 healthy donors, respectively. The clinical information is shown in Supplementary Table S1. Background correction and quantile normalization were performed by Robust multi-array analysis method.16 Batch effect was carefully considered by R package BatchI (v2.0; R Foundation for Statistical Computing, Vienna, Austria).17 Medians were considered as gene expression values if the multiple probes were mapped to the same gene symbol.
Weighted gene co-expression network analysis
Considering the capacity and stability of bioinformatics statistics, the top 25% genes in the rank of the variance of expression were selected to build the gene network by R package WGCNA (v1.69; R Foundation for Statistical Computing).11 Firstly, an essential parameter to build the scale-free network, soft-thresholding power, was determined by functions softConnectivity and pickSoftThreshold. In brief, the influence of power values on the mean connectivity and scale independence was analyzed by these functions. The function softConnectivity calculated the network connectivity, and the function pickSoftThreshold calculated the scale-free topology fit index for different powers. When the scale-free topology fit index reaches 0.9 at the powers < 30 and the network harboured an appropriate network connectivity, the soft-thresholding power was determined, at which the topology network was considered scale-free and suitable for further analysis. Then, the adjacency matrix was converted into Topological Overlap Matrix (TOM), in which parts of genes harbouring the high topological overlap with others were hierarchically clustered. With the parameters set up as minModuleSize = 30 and deepsplit = 2, the modules were identified by Dynamic Tree Cut algorithm. Based on the module eigengene calculated to represent the modules in a 1D vector, the close modules are merged by hierarchical clustering and Merged Dynamic algorithm (cutheight = 0.25). Finally, the eigengenes were used to calculate the correlation between the modules and RA. In addition, the Pearson correlation coefficient was calculated to quantify the correspondence between modules and RA, and to identify the RA-related modules with the criterions of the Pearson correlation coefficient r > 0.4 and p < 0.05.
Functional enrichment analysis
R package ClusterProfiler (v3.14.3; R Foundation for Statistical Computing) was used to analysis the Gene Ontology (GO) and Kyoto Encyclopedia of Genes and Genomes (KEGG) to annotate RA-related modules.18 Based on hypergeometric distribution, the functions enrichGO and enrichKEGG were utilized to perform enrichment test for GO terms and KEGG pathways, the results of which were visualized by bubble plot. The heatmap of enriched genes and the regulation network of enriched genes and relevant pathways were plotted by function heatplot and KEGGcnetplot, respectively.
Hub gene and long noncoding RNA identification
Hub genes are the key regulators with high degree or connectivity in the scale-free network. In order to identify the hub genes in the RA-related modules, three parameters including Gene Significance (GS), Module Membership (MM), and the degree in the RA-related module were utilized. GS reflects the inter-relation between genes and sample traits. MM reflects the inter-relation between the genes and module eigengenes. Degree determines the gene connectivity in the network. Hub genes were defined as the intersection of the top 10% genes in the rank of the degree and the genes with both the absolute values of MM and GS both larger than 0.7 and the p-value less than 0.01, harbouring high connectivity both in the gene-phenotype mapping and gene co-expression networks. The probe IDs of the platform of Affymetrix Human Genome U133A Array (HG-U133A) were converted to ENSG IDs annotated by Ensembl database (Release 98; European Molecular Biology Laboratory's European Bioinformatics Institute (EMBI-EBI), Hinxton, UK) and then 106 lncRNAs were identified based on Ensembl database (Release 98) and verified by NONCODE database (v5.0),19 the regulatory networks of which were constructed and visualized by Cytoscape (Institute for Systems Biology (ISB), Seattle, Washington, USA).
Compound screening based on modules
CMap is a powerful tool for screening of compounds against a genome-wide disease or physiological gene signature by comparing microarray data from more than 1,300 small molecules to the gene signature of the phenotype of interest using a pattern-matching algorithm with a high level of resolution and specificity.13,14 To find the potential therapeutic compound with high specificity and broad coverage for the RA-related modules, we mapped the gene expression signature of each module to CMap to link the compounds to the modules and performed the intersection of the compounds targeting the corresponding module. Enrichment scores, used to quantize the similarity between the gene expression signature of compounds and modules, were adjusted by the module-trait correlation coefficient, generating an integrated score, namely the module-adjusted score (MAS), to evaluate the connectivity of compounds and RA. The MAS is calculated using the following formula:
Results
Data processing and soft-thresholding power determination
The gene expression matrices were obtained after profile pre-processing (background correction and normalization). To identify the potential outliers, samples were clustered based on the corresponding expression matrices. The dendrogram of the hierarchical clustering is shown in Supplementary Figure S1. A total of eight normal samples and one RA sample were identified as the outliers and removed from the analysis. As shown in Figures 1a and 1b, the sample clustering revealed the high correlation of the phenotypes and expression profiles after excluding the outliers. Among the 22,283 probes in expression profile (Affymetrix Human Genome U133A Array), the top 25% genes in the rank of the expression variance were selected to perform the analysis of the network topology for different powers in order to balance the mean connectivity and scale independence. As shown in Figure 1c, the power of 13 is the lowest power for which the scale-free topology fit index reaches 0.90.
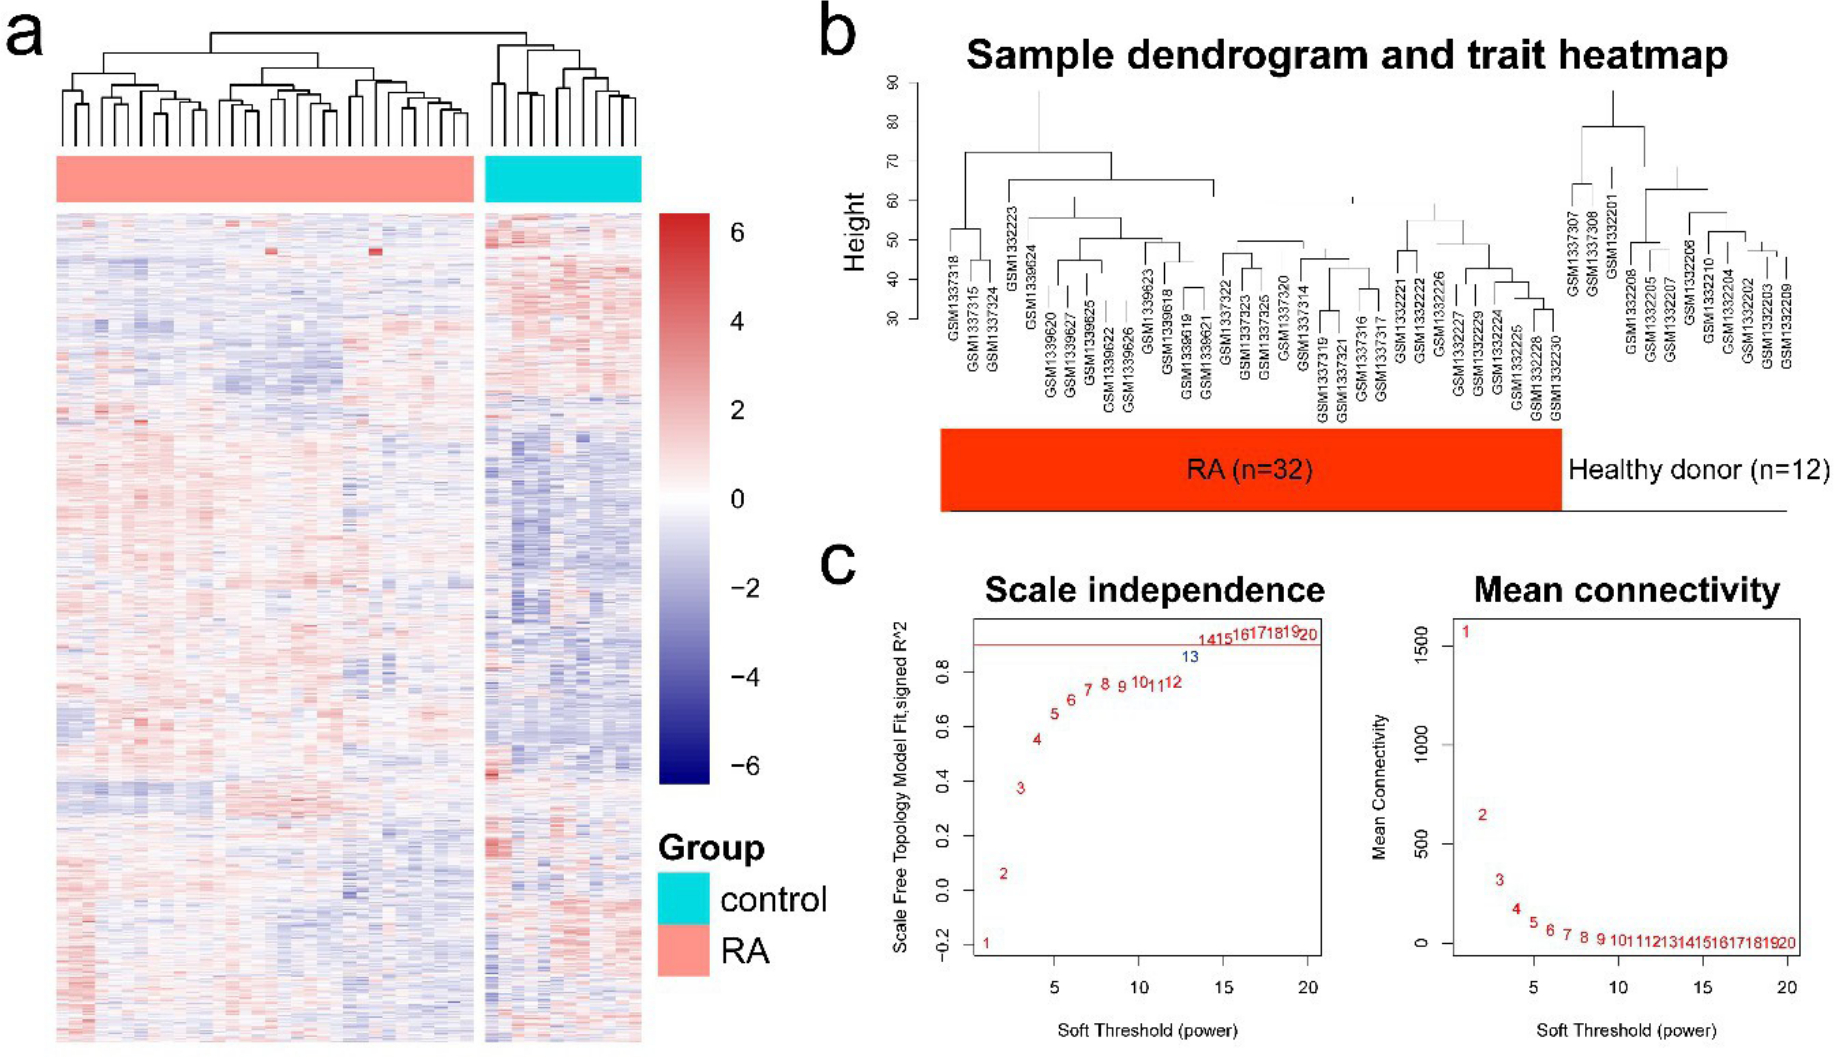
Fig. 1
Sample clustering and soft-thresholding power determination. a) Heatmap plot of the top 25% genes in rank of variance. b) Sample clustering dendrogram of the joint synovial samples of 32 rheumatoid arthritis (RA) patients and 12 healthy donors. The samples clustered based on their Euclidean distance calculated with variance stabilized expression levels. c) Analysis of the scale-free fit index for various soft-thresholding powers.
Weighted co-expression network and RA-related module identification
With the soft-thresholding power of 13, the scale-free topology model was constructed and the adjacency matrix was converted into a TOM (Figure 2a). A total of 21 modules were identified by average linkage hierarchical clustering of gene expression and dynamic tree cut method, which were subsequently merged to 13 modules by module eigengene clustering (Figure 2b). The module eigengene calculated by the first principal component to represent each module was applied to analyze the correlation of each module (Figure 2c and 2d). To identify the RA-related modules, the correlation between module eigengene and RA was calculated by one-way analysis of variance (ANOVA) (significant p-value < 0.05). As shown in Figure 3a, the green module showed the highest correlation with RA (r = −0.93; p = 1e-19, one-way ANOVA). Besides, the greenyellow module (r = 0.91; p = 7e-18, one-way ANOVA), the lightcyan module (r = −0.59; p = 2e-05, one-way ANOVA), and the turquoise module (r = 0.59; p = 2e-05, one-way ANOVA) were also relevant to RA. Due to the high relevance for RA (|r|> 0.9), the green module and the greenyellow module were selected as modules of interest and studied in subsequent analyses.
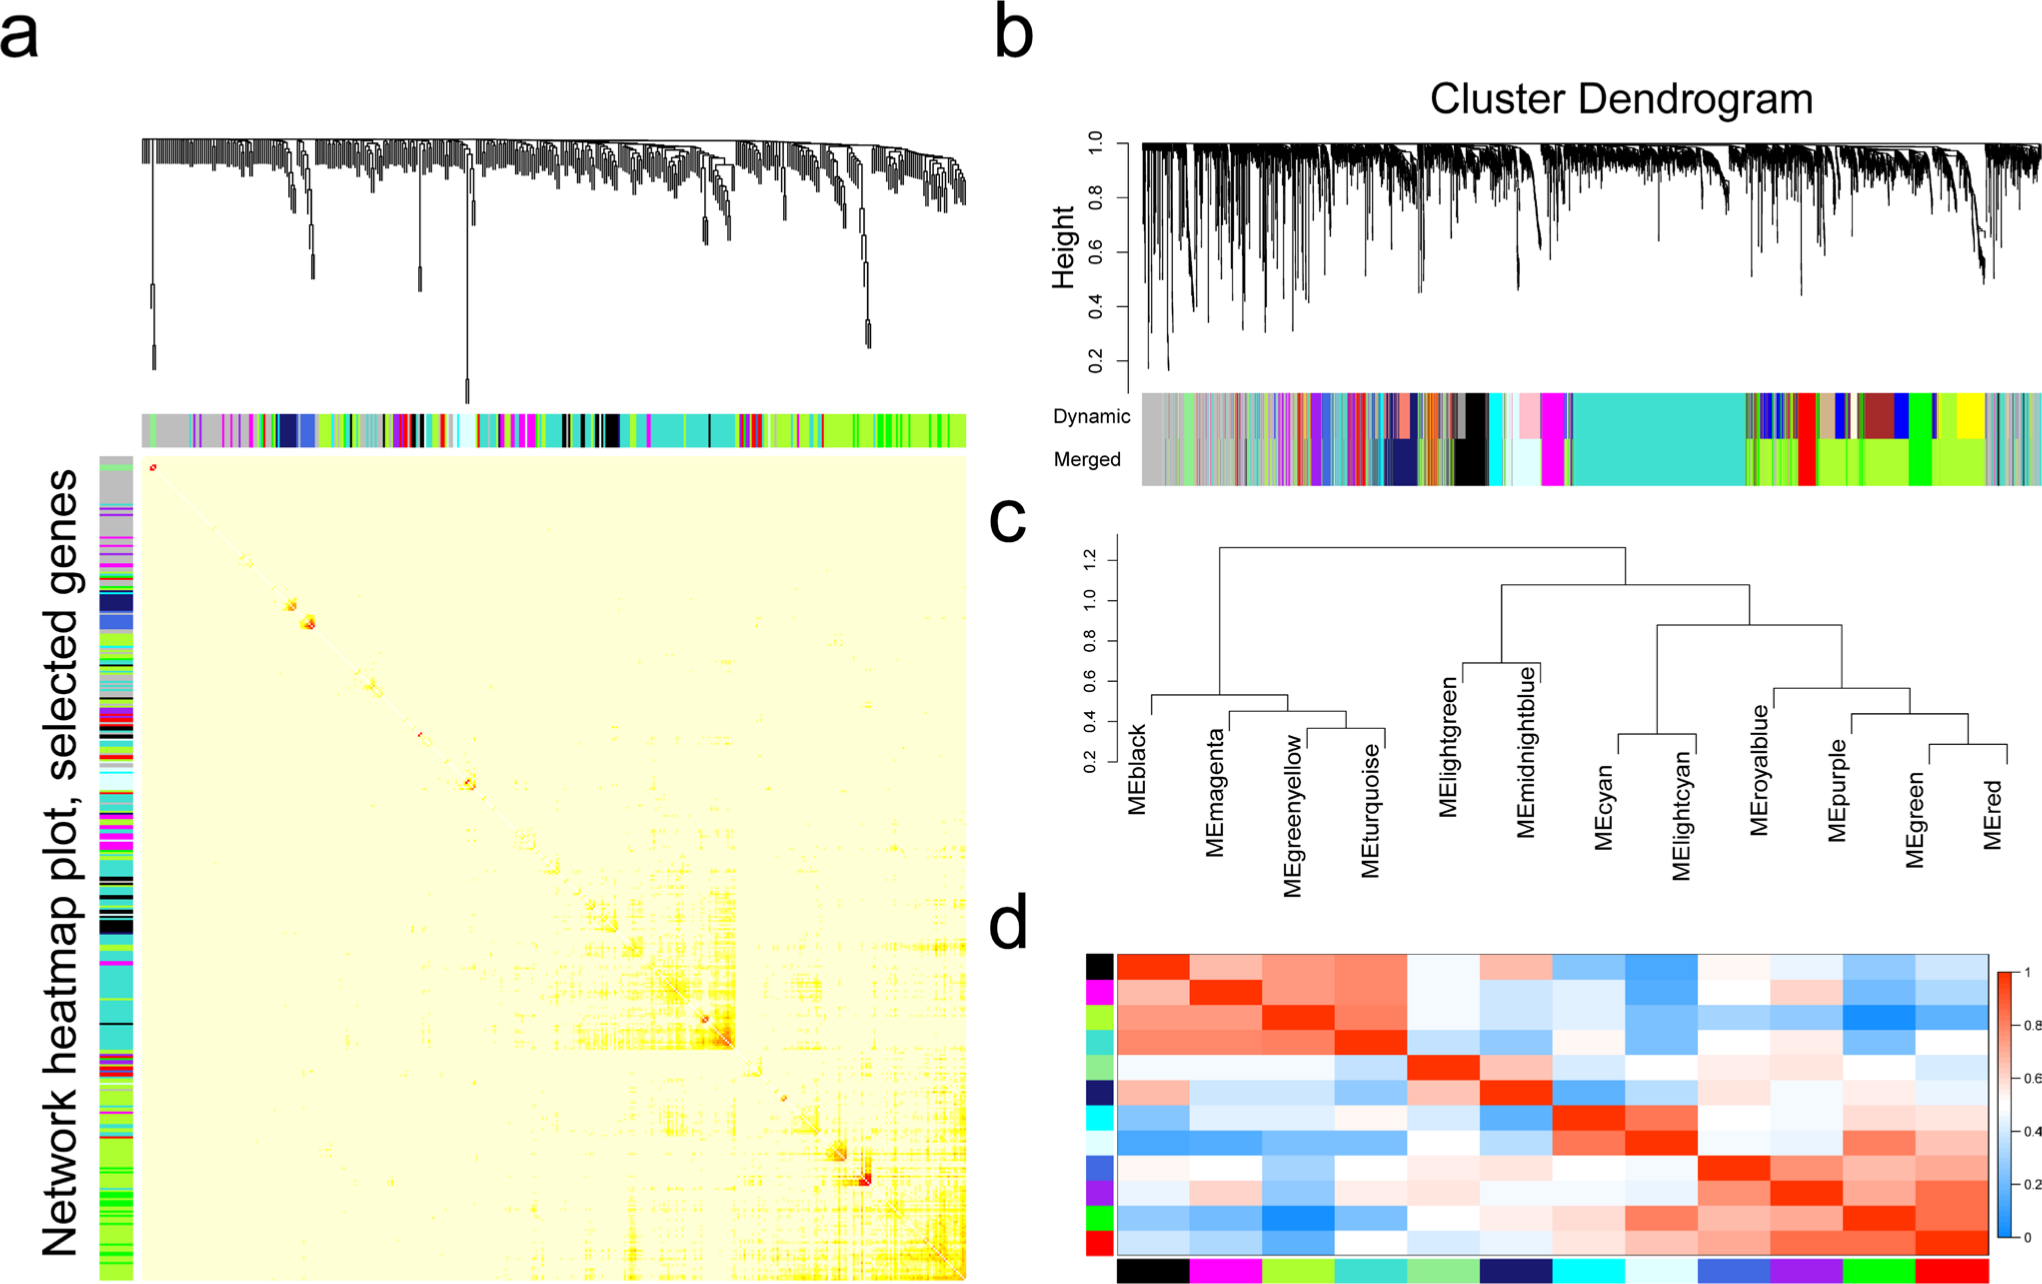
Fig. 2
Topological overlap calculation and module identification. a) Heatmap plot of topological overlap in the gene network. Red squares along the diagonal correspond to modules. b) Gene dendrogram calculated by average linkage hierarchical clustering. The colour row underneath the dendrogram shows the assigned original module and the merged module. c) Hierarchical clustering of module eigengenes that summarize the modules identified in the clustering analysis. d) Heatmap plot of the eigengene adjacencies. Each row and column in the heatmap corresponds to one module eigengene.
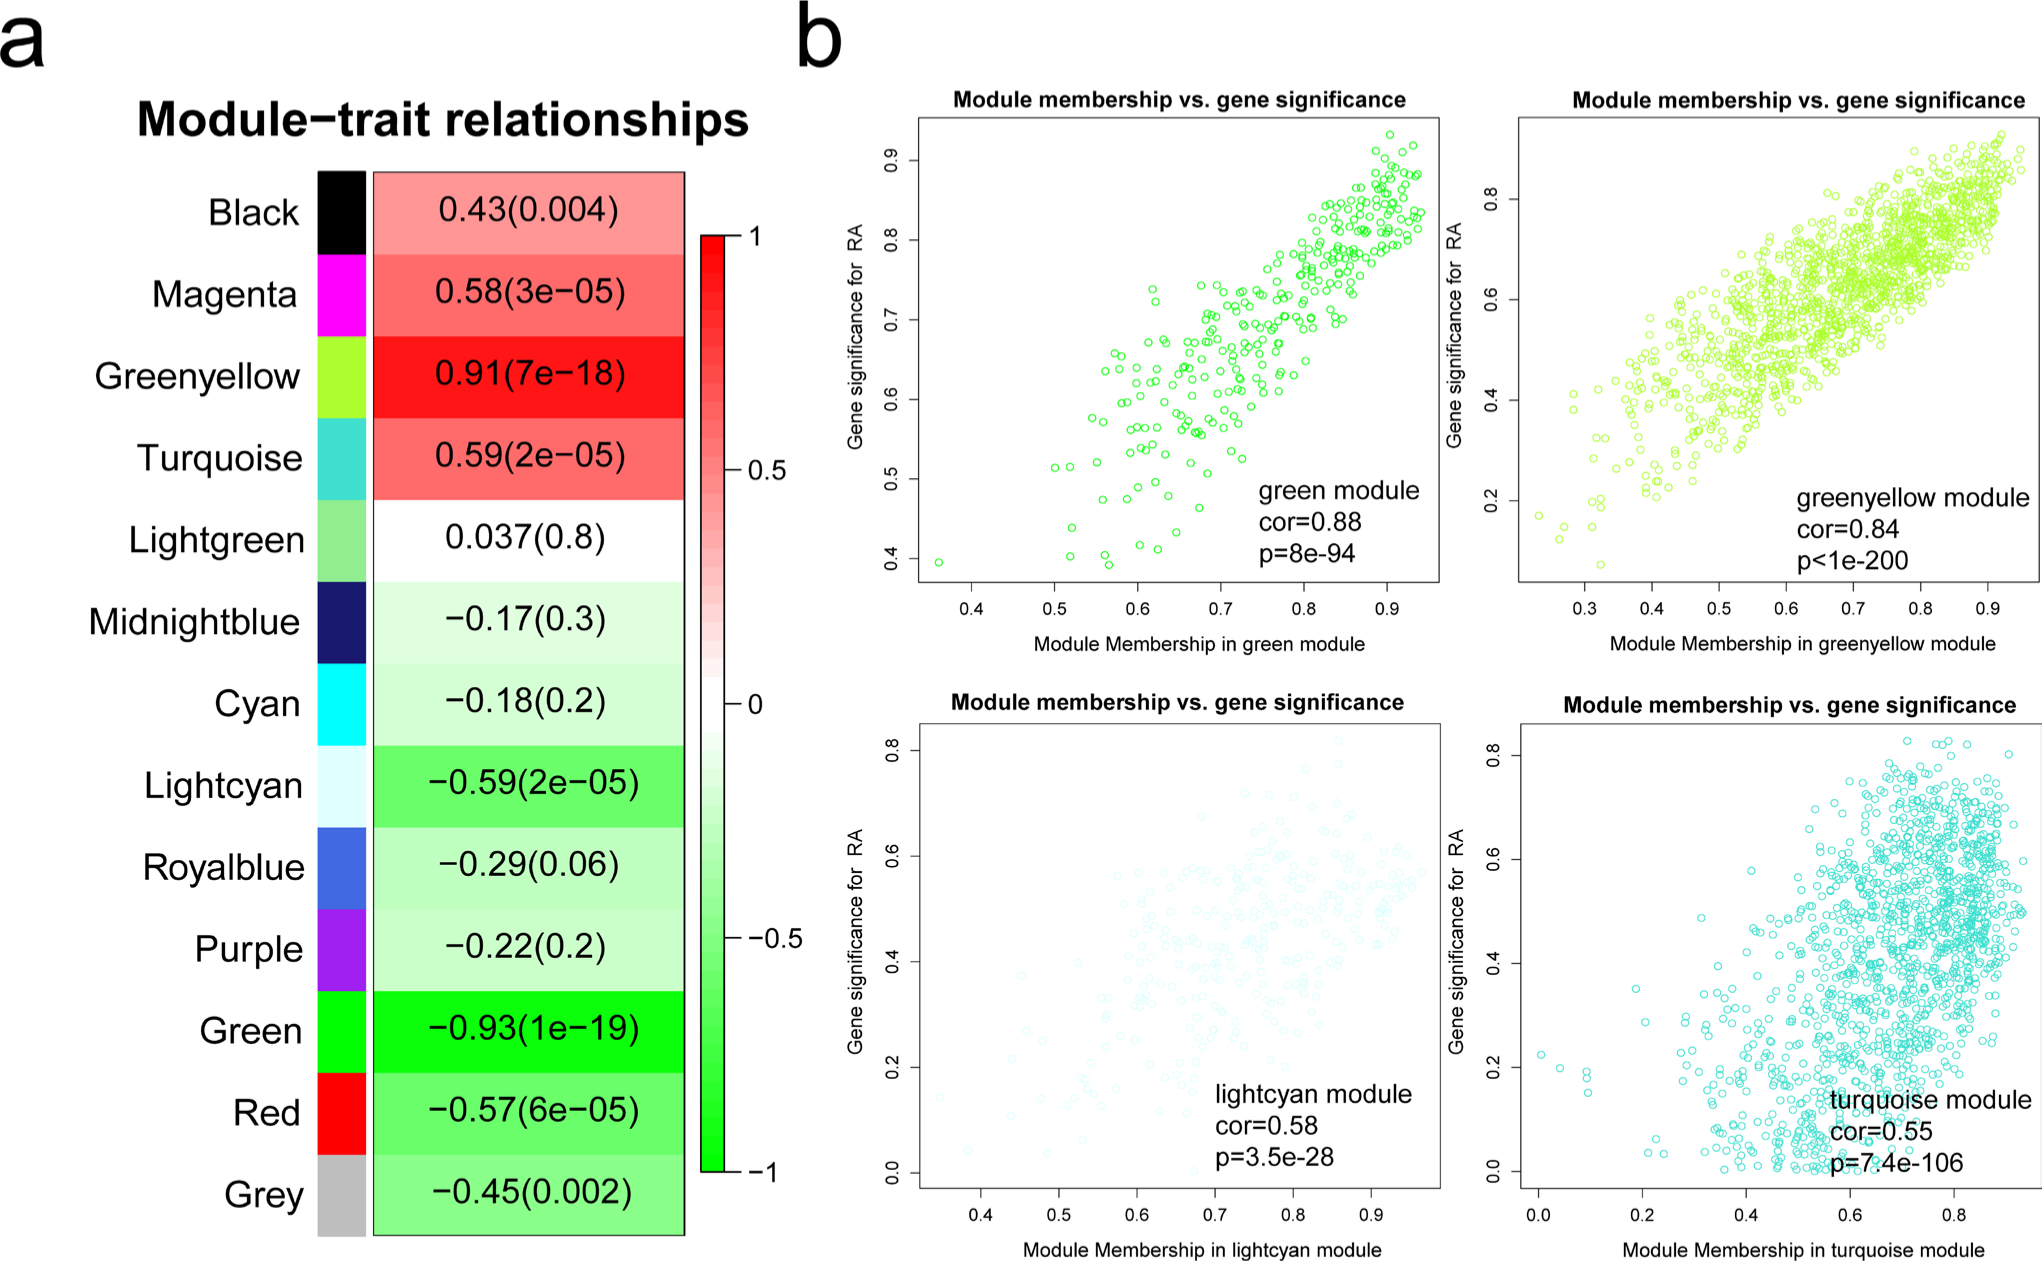
Fig. 3
Identification of modules associated with rheumatoid arthritis (RA). a) Heatmap of the correlation between module eigengenes and RA. The value in each square and the p-value in parentheses reflect the correlation coefficient between the module eigengene and RA. b) Scatter plot for correlation between gene significance (GS) and gene module membership (MM) in RA-related modules (green, greenyellow, lightcyan, and turquoise). All p-values were calculated using one-way analysis of variance and Pearson correlation coefficient.
Functional annotation of RA-related modules
In order to explore the biological relevance of RA-related modules, 282 genes in the green module and 1,263 genes in the greenyellow module were subjected to GO functional and KEGG pathway enrichment analyses. With the threshold of p-value adjusted by Benjamini and Hochberg method less than 0.05, the biological processes of the green module were mainly involved in the response to lipopolysaccharide (p = 2.21e-10, independent-samples t-test), the response to molecule of bacterial origin (p = 5.88e-10), the positive regulation of cell-cell adhesion (p = 1.15e-09), the response to glucocorticoid (p = 1.16e-09), and fat cell differentiation (p = 2.99e-09) (Figure 4a). In the KEGG analysis, the green module was mainly involved in the infection-related pathways including human T-cell leukaemia virus 1 infection (p = 6.08e-13) and leishmaniasis (p = 2.32e-10) and the immune-related pathways such as inflammatory bowel disease (p = 6.48e-10), asthma (p = 1.31e-09), and RA (p = 2.89e-09) (Figure 4b). Major histocompatibility complex Class II (MHC Class II) genes including HLA-DMA, HLA-DMB, HLA-DPA1, HLA-DPB1, HLA-DQB1, HLA-DRA, and HLA-DRB1 exhibited high connectivity to the enriched pathways in the green module (Figure 4c).
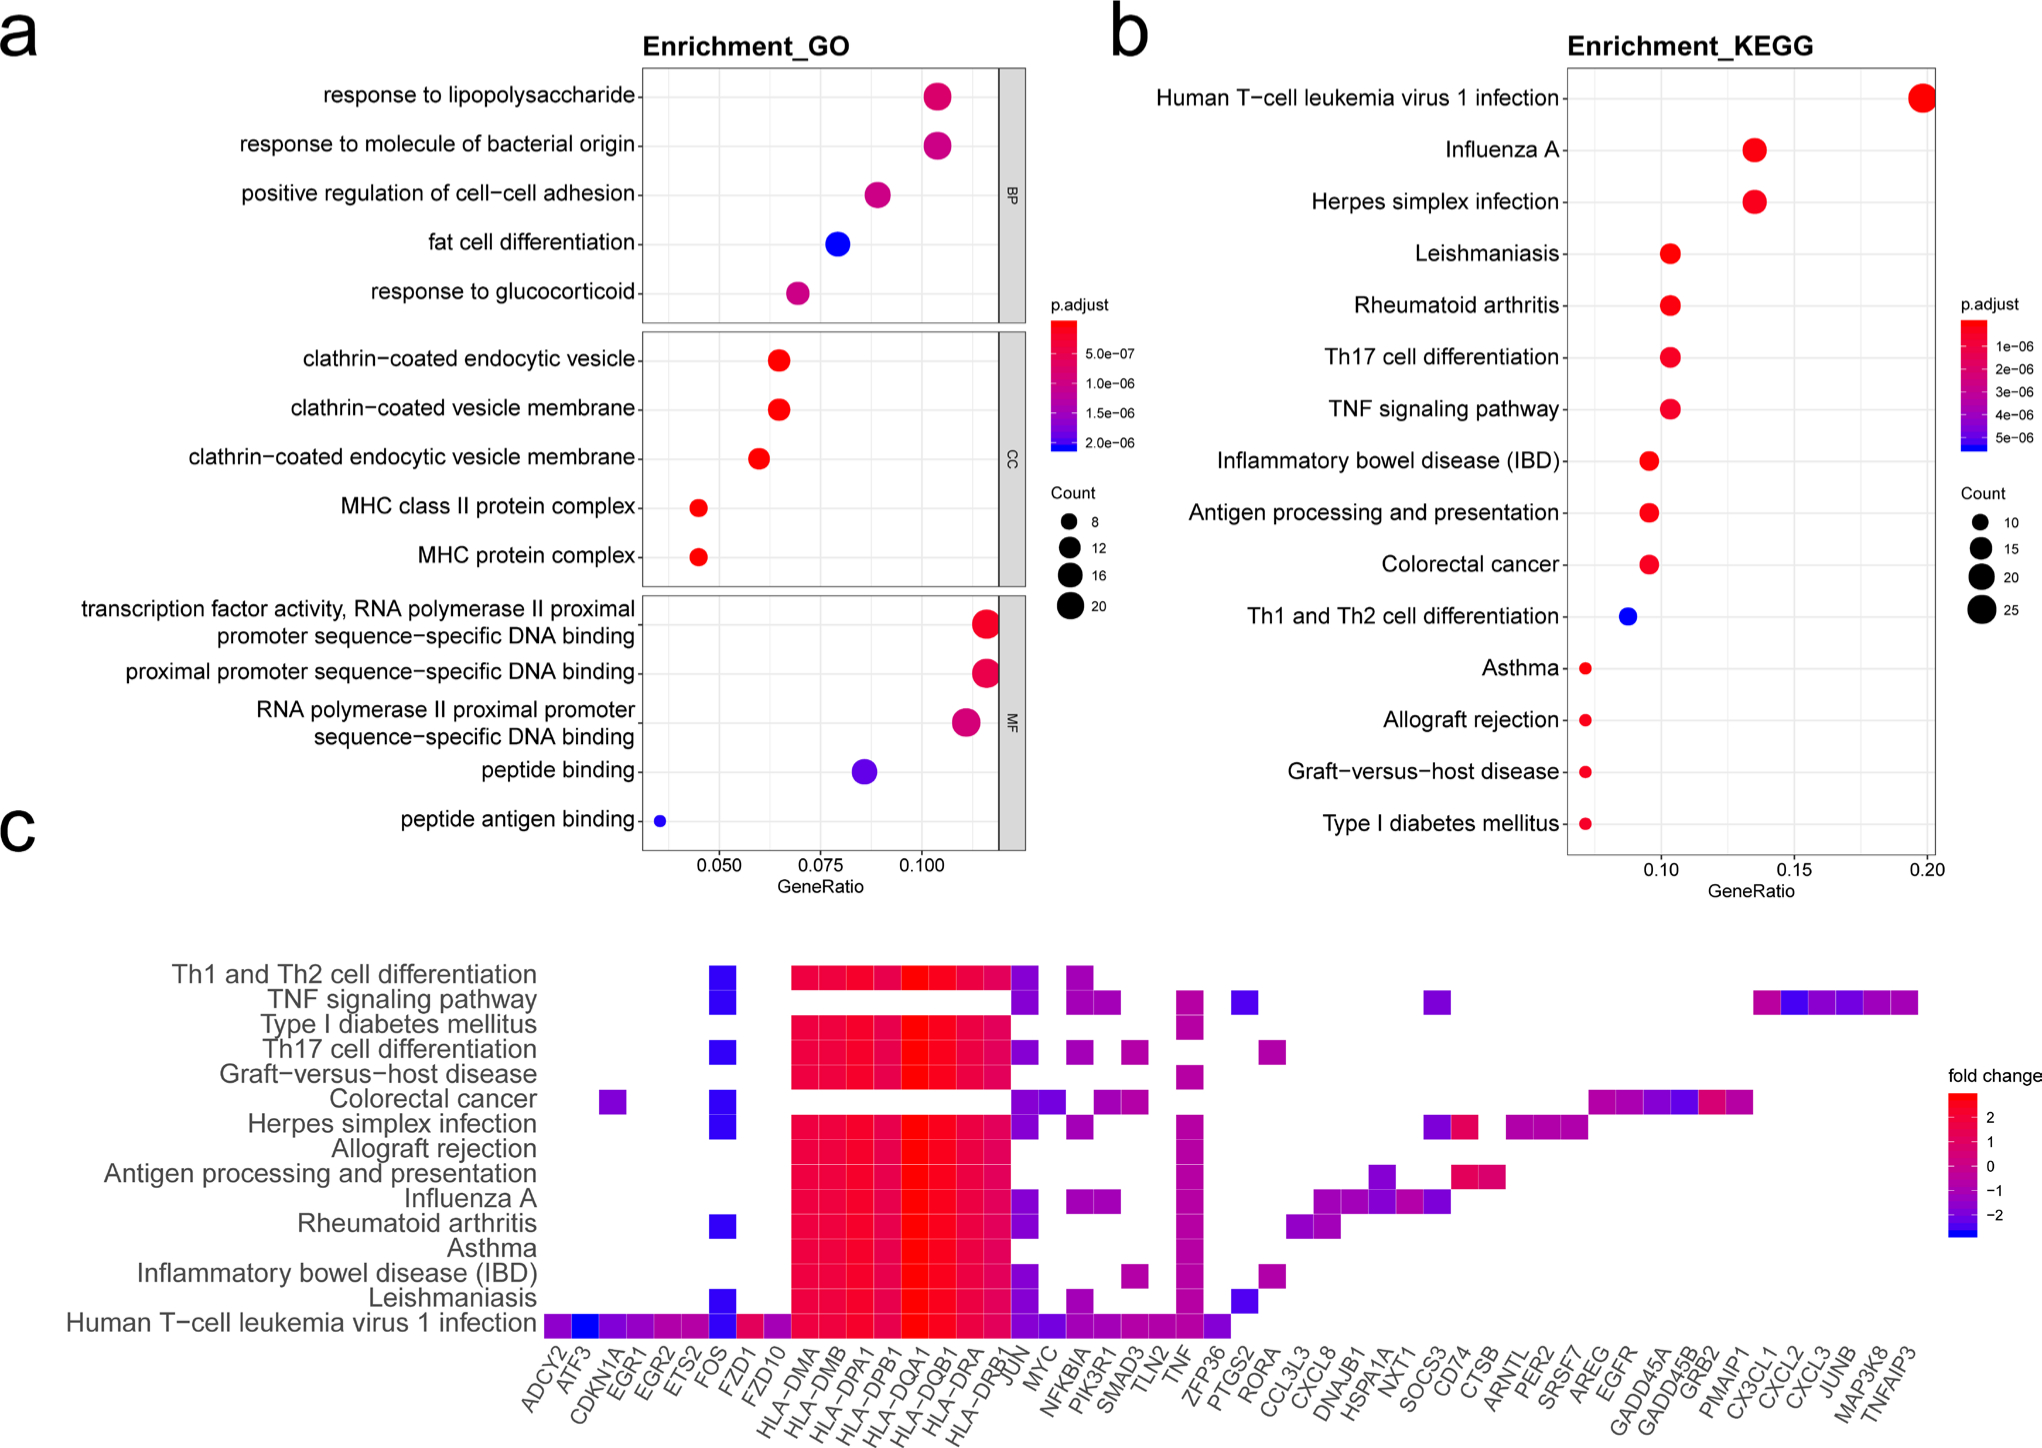
Fig. 4
Functional annotation of green module. a) Gene ontology (GO) term enrichment and b) Kyoto Encyclopedia of Genes and Genomes (KEGG) pathway analysis of green module. GeneRatio indicates the gene number ration in each of the GO functions and KEGG pathways. The colour and size of each dot represents a p-value (calculated by independent-samples t-test and adjusted using the Benjamini and Hochberg method and gene number assigned to the corresponding GO term and KEGG pathway, respectively. c) Heatmap plot of enriched genes in KEGG pathways. BP, biological process; CC, cellular component; MF, molecular function; MHC, major histocompatibility complex; Th, T helper cell; TNF, tumour necrosis factor.
The greenyellow module was mainly involved in the immune-related biological processes including the immune response-regulating cell surface receptor signalling pathway (p = 2.86e-32, independent-samples t-test and adjusted by Benjamini and Hochberg method), the regulation of lymphocyte activation (p = 4.25e-32), immune response-activating cell surface receptor signalling pathway (p = 3.19e-31), the positive regulation of cell activation (p = 6.20e-29), and B cell activation (p = 6.95e-29) (Figure 5a). In the KEGG pathway analysis, the greenyellow module showed strong relevance to Fc γ R (FcγR)-mediated phagocytosis (p = 3.40e-11), osteoclast differentiation (p = 7.65e-11), phagosome (p = 4.96e-10), haematopoietic cell lineage (p = 9.37e-10), and primary immunodeficiency (p = 7.02e-09) (Figure 5b). Fc fragment of immunoglobulin G (IgG) receptors in the most significant enriched pathway, including FCGR2A, FCGR2B, and FCGR3A, also participated in other module-related pathways such as osteoclast differentiation and phagosome (Figure 5c).
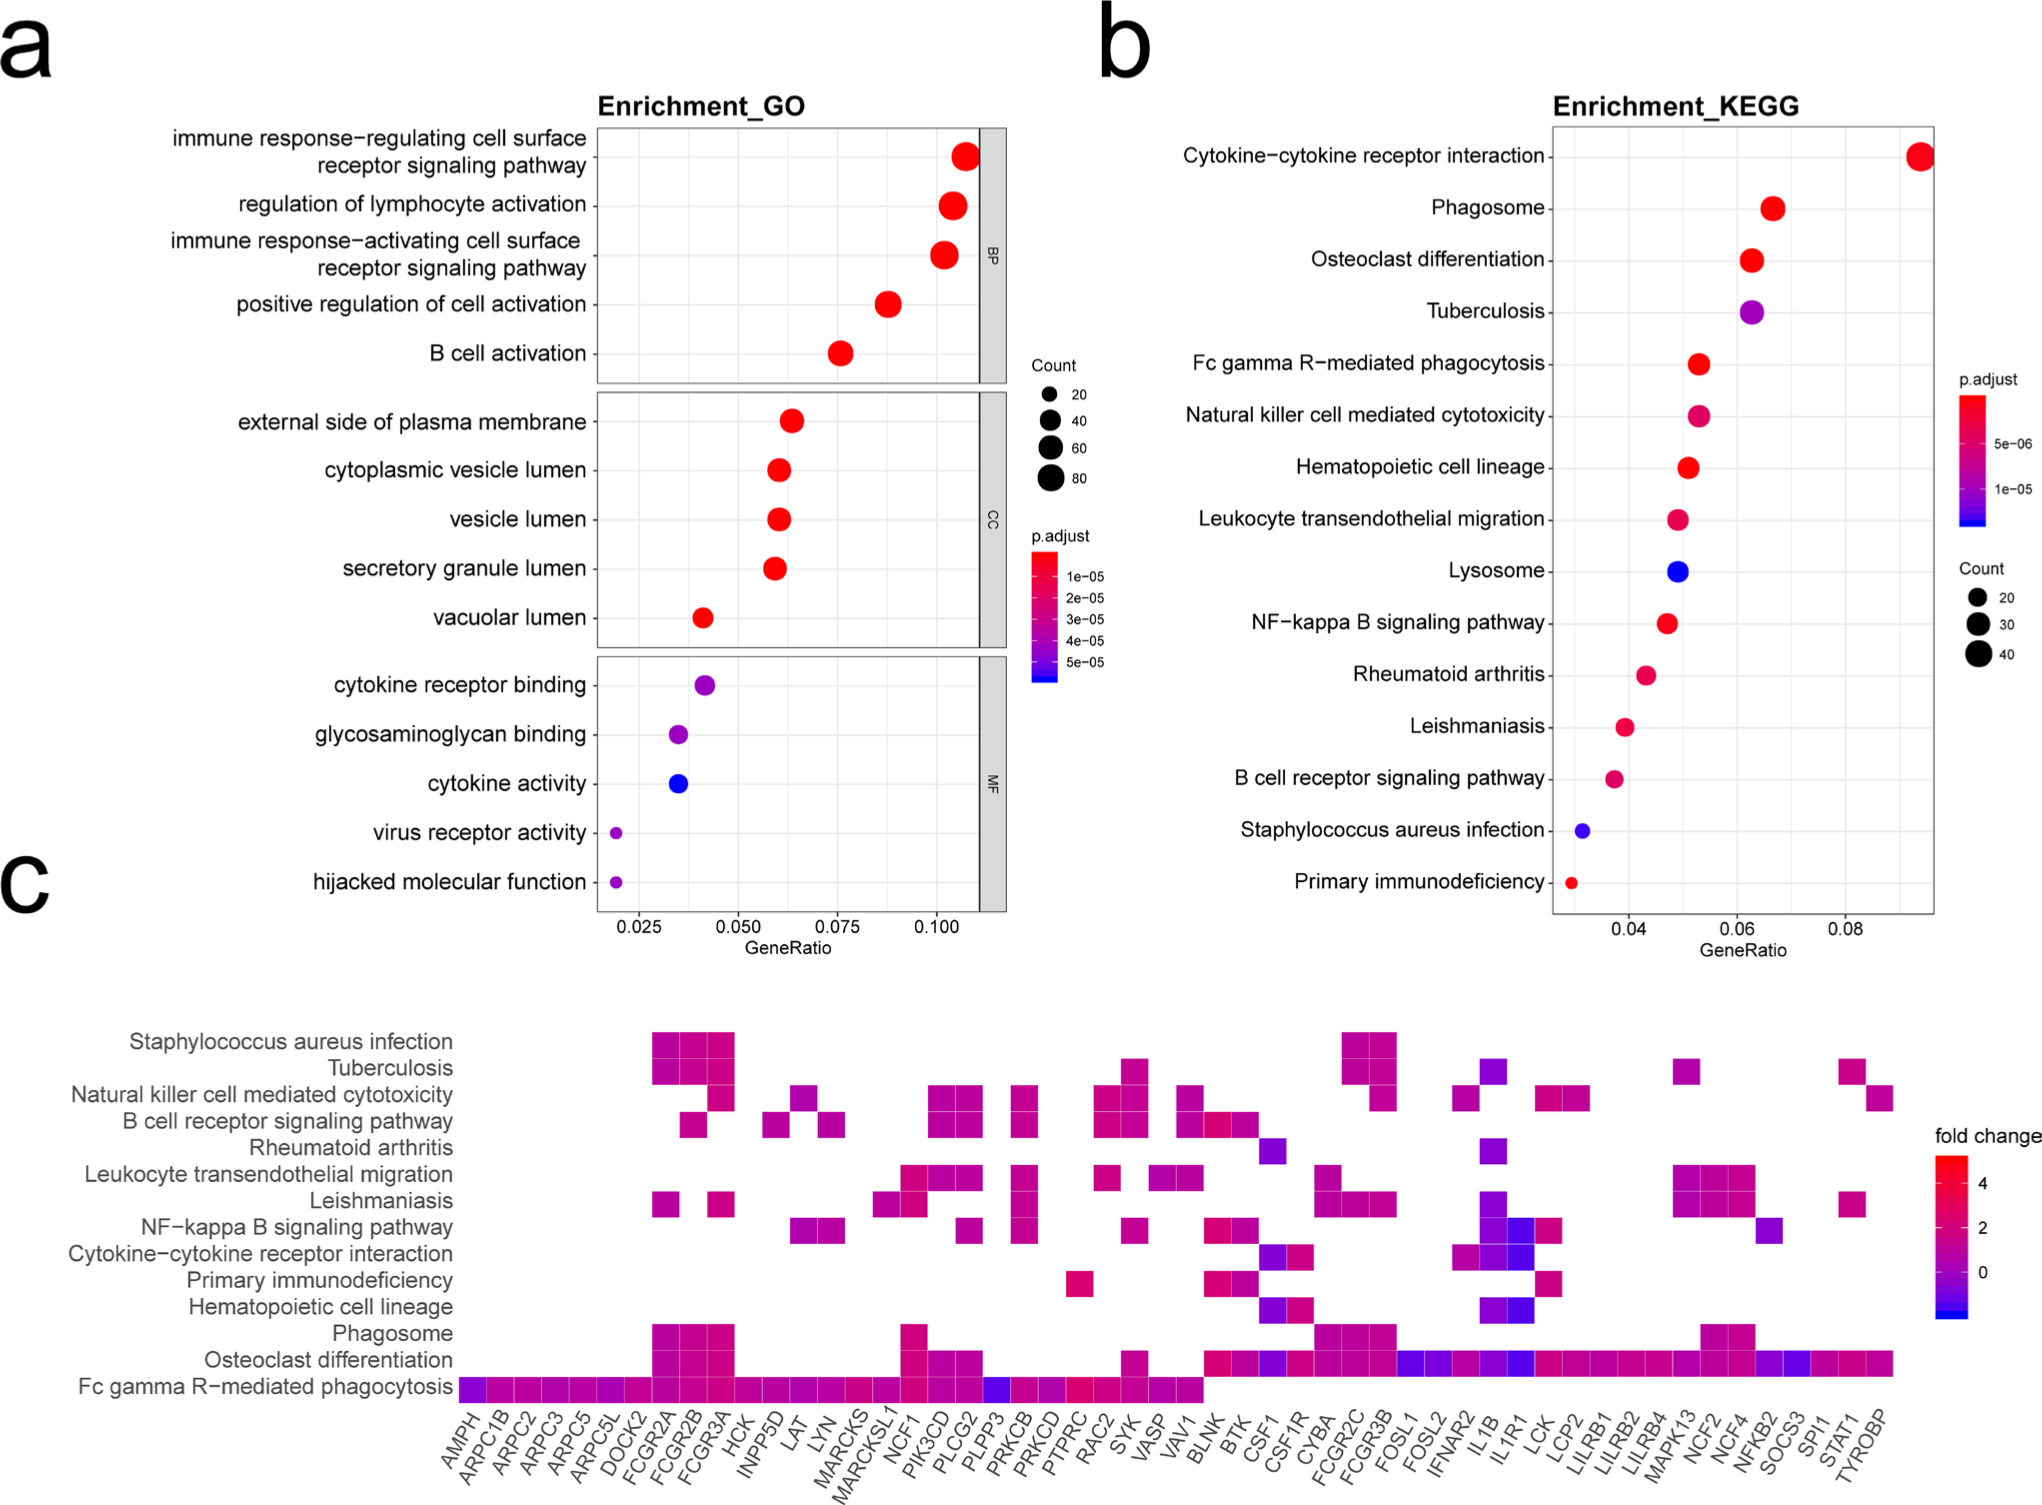
Fig. 5
Functional annotation of greenyellow module. a) Gene ontology (GO) term enrichment and b) Kyoto Encyclopedia of Genes and Genomes (KEGG) pathway analysis of greenyellow module. GeneRatio indicates the gene number ration in each of the GO functions and KEGG pathways. The colour and size of each dot represents a p-value adjusted using the Benjamini and Hochberg method and gene number assigned to the corresponding GO term and KEGG pathway, respectively. c) Heatmap plot of enriched genes in KEGG pathways. BP, biological process; CC, cellular component; MF, molecular function; NF-kappa B, nuclear factor kappa-light-chain-enhancer of activated B cells.
Identification of hub genes in RA-related modules
The hub genes were defined as the genes with high connectivity both in gene regulation network and gene-phenotype mapping. The intersection of the top 10% genes in the rank of degree and the genes with both the absolute value of MM and GS larger than 0.7 and p-value less than 0.01 was identified as the hubs in the RA-related modules. In the green module, all the genes with top 10% degree had high |MM| and |GS| (Figure 6a), among which MHC Class II genes including HLA-DMA (log2FC = 1.79; p = 1.10e-12, calculated by independent-samples t-test and adjusted by Benjamini and Hochberg method), HLA-DMB (log2FC = 1.86; p = 8.25e-17), HLA-DPA1 (log2FC = 1.21; p = 2.31e-08), HLA-DPB1 (log2FC = 1.51; p = 8.35e-12), HLA-DQB1 (log2FC = 2.28; p = 1.82e-09), HLA-DRA (log2FC = 1.67; p = 9.95e-12), and HLA-DRB1 (log2FC = 1.19; p = 4.09e-11) were identified as the core hubs because of their high connectivity to the significant pathways in the green module (Figure 6b and Table I). In the greenyellow module, 120 genes were recognized as the hub genes (Figure 6c), among which BLNK (log2FC = 2.20; p = 8.86e-15), BTK (log2FC = 0.79; p = 1.58e-11), CD3D (log2FC = 1.72; p = 8.59e-09), CD4 (log2FC = 1.02; p = 2.99e-11), IL2RG (log2FC = 1.15; p = 2.26e-08), INPP5D (log2FC = 0.88; p = 1.09e-09), LCK (log2FC = 1.69; p = 8.76e-09), PTPRC (log2FC = 2.11; p = 2.38e-10), RAC2 (log2FC = 1.07; p = 1.11e-05), SYK (log2FC = 1.25; p = 2.55e-11), and VAV1 (log2FC = 0.90; p = 8.32e-09) were identified as the core hubs functionally relevant to the greenyellow module (Figure 6d and Table I).
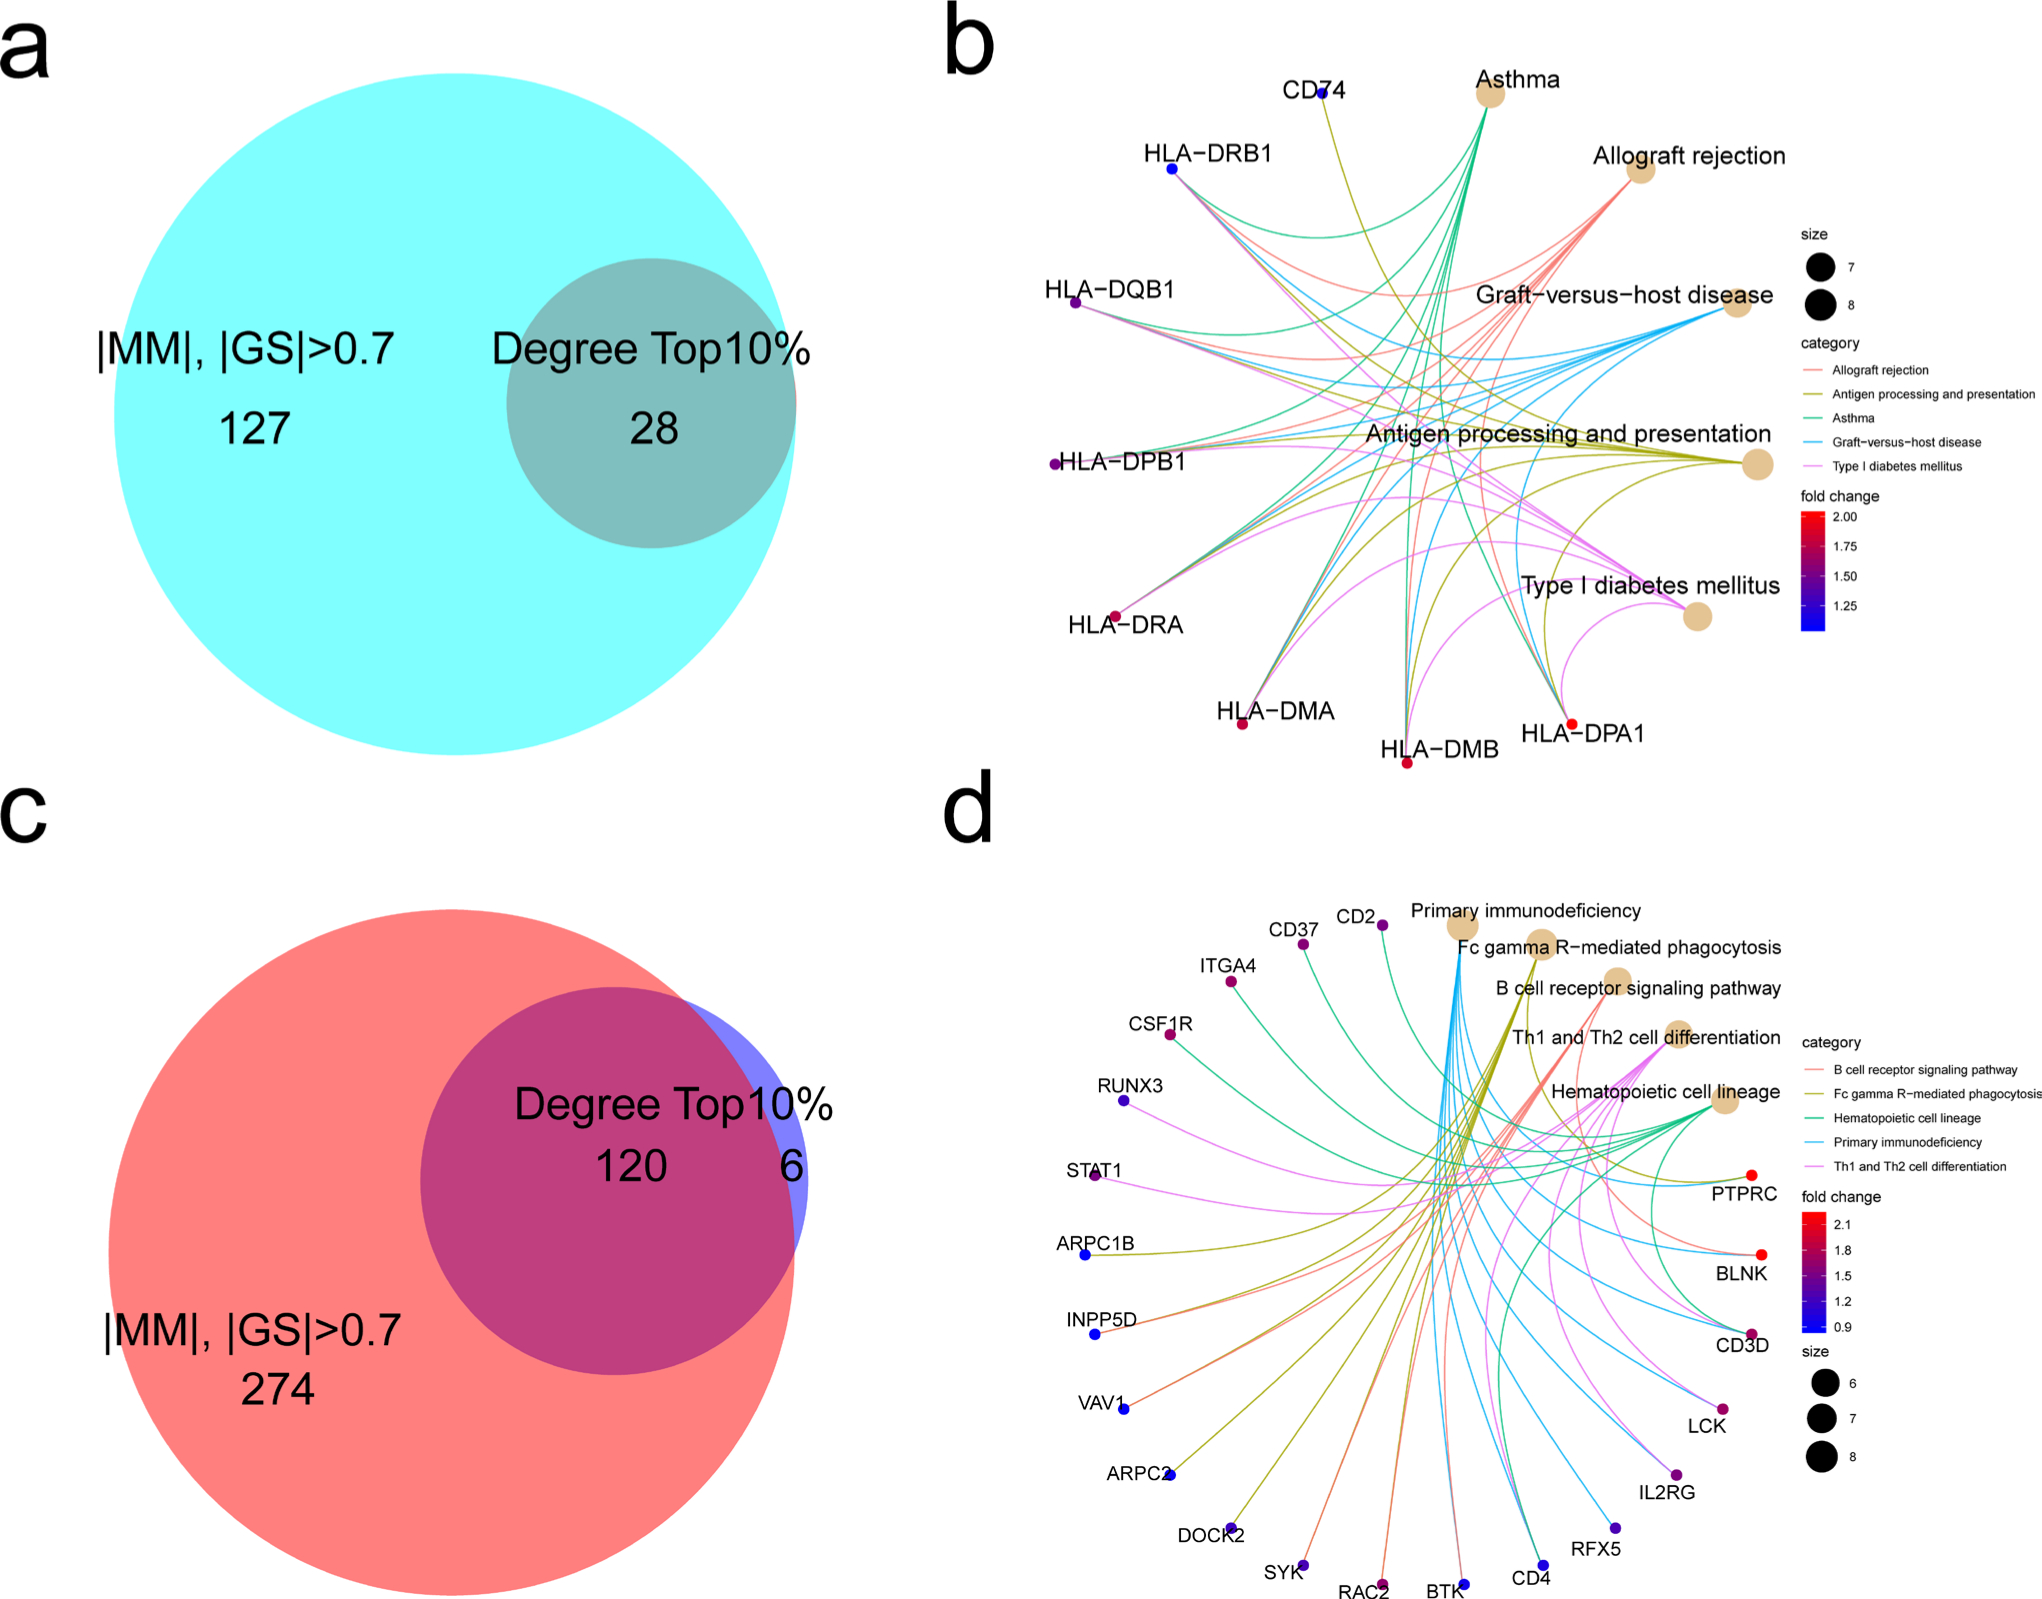
Fig. 6
Identification of hub genes in rheumatoid arthritis (RA)-related modules. The overlap of top 10% genes in the rank of degree and the genes with both absorb value of Module Membership (MM) and Gene Significance (GS) larger than 0.7 and p-value larger than 0.01 in the a) green module and c) greenyellow module. The hub genes related to enriched pathways are shown in the b) green module and d) greenyellow module. Th, T helper cell.
Table I.
Hub genes in rheumatoid arthritis-related modules.
| Gene symbol | ENSG ID | log2FC | P.log2FC* | GS | P.GS† | MM | P.MM† | Pathway‡ | Module |
|---|---|---|---|---|---|---|---|---|---|
| BLNK | ENSG00000095585 | 2.20 | 8.86E-15 | 0.86 | 5.59E-14 | 0.89 | 3.05E-16 | 2 | greenyellow |
| BTK | ENSG00000010671 | 0.97 | 1.58E-11 | 0.81 | 4.34E-11 | 0.91 | 2.28E-17 | 2 | greenyellow |
| CD3D | ENSG00000167286 | 1.72 | 8.59E-09 | 0.73 | 2.45E-08 | 0.88 | 2.81E-15 | 3 | greenyellow |
| CD4 | ENSG00000010610 | 1.02 | 2.99E-11 | 0.80 | 8.58E-11 | 0.90 | 6.83E-17 | 3 | greenyellow |
| IL2RG | ENSG00000147168 | 1.54 | 2.26E-08 | 0.71 | 6.01E-08 | 0.85 | 3.32E-13 | 2 | greenyellow |
| INPP5D | ENSG00000168918 | 0.88 | 1.09E-09 | 0.76 | 2.55E-09 | 0.89 | 4.52E-16 | 2 | greenyellow |
| LCK | ENSG00000182866 | 1.69 | 8.76E-09 | 0.73 | 2.49E-08 | 0.86 | 1.08E-13 | 2 | greenyellow |
| PTPRC | ENSG00000081237 | 2.11 | 2.38E-10 | 0.77 | 8.55E-10 | 0.91 | 1.40E-17 | 2 | greenyellow |
| RAC2 | ENSG00000128340 | 1.07 | 1.11E-05 | 0.60 | 2.02E-05 | 0.76 | 3.04E-09 | 2 | greenyellow |
| SYK | ENSG00000165025 | 1.25 | 2.55E-11 | 0.80 | 8.55E-11 | 0.90 | 7.71E-17 | 2 | greenyellow |
| VAV1 | ENSG00000141968 | 0.90 | 8.32E-09 | 0.73 | 1.89E-08 | 0.89 | 1.11E-15 | 2 | greenyellow |
| HLA-DMA | ENSG00000204257 | 1.79 | 1.10E-12 | 0.83 | 5.03E-12 | -0.92 | 3.35E-18 | 5 | green |
| HLA-DMB | ENSG00000242574 | 1.86 | 8.25E-17 | 0.89 | 5.91E-16 | -0.91 | 1.54E-17 | 5 | green |
| HLA-DPA1 | ENSG00000231389 | 1.21 | 2.31E-08 | 0.71 | 5.78E-08 | -0.83 | 3.02E-12 | 5 | green |
| HLA-DPB1 | ENSG00000223865 | 1.51 | 8.35E-12 | 0.81 | 3.25E-11 | -0.90 | 1.53E-16 | 5 | green |
| HLA-DQB1 | ENSG00000179344 | 2.28 | 1.82E-09 | 0.75 | 5.89E-09 | -0.85 | 1.52E-13 | 5 | green |
| HLA-DRA | ENSG00000204287 | 1.67 | 9.95E-12 | 0.81 | 3.99E-11 | -0.92 | 5.56E-19 | 5 | green |
| HLA-DRB1 | ENSG00000196126 | 1.19 | 4.09E-11 | 0.79 | 1.31E-10 | -0.91 | 3.00E-17 | 5 | green |
-
FC, the fold change of rheumatoid arthritis (RA) compared to healthy donors; GS, gene significance; MM, gene module membership. P.log2FC, P.GS, and P.MM represent the p-values of log2FC, MM, and GS, respectively.
-
*
Calculated by independent-samples t-test and adjusted by Benjamini and Hochberg method.
-
†
Pearson correlation coefficient.
-
‡
The enriched pathway numbers of hub genes.
Identification of lncRNAs in RA-related modules
Long noncoding RNAs (lncRNAs) are emerging players in various diseases, such as RA and osteoarthritis. A total of six lncRNAs were identified in the greenyellow and lightcyan modules, including FAM30A (log2FC = 0.75; p = 3.63e-03, calculated by independent-samples t-test and adjusted by Benjamini and Hochberg method), NEAT1 (log2FC = −1.63; p = 7.64e-06), MEG3 (log2FC = −0.86; p = 3.55e-05), SND1-IT1 (log2FC = −0.41; p = 3.32e-03), SNHG17 (log2FC = −0.83; p = 7.41e-06), and THAP9-AS1 (log2FC = −0.58; p = 3.28e-04), among which FAM30A in the greenyellow module and NEAT1 in the lightcyan module were recognized as the significant regulators with the high degree of 127 and 73, respectively (Table II).
Table II.
Long noncoding RNAs in rheumatoid arthritis-related modules.
| Gene symbol | ENSG ID | log2FC | P.log2FC* | MM | P.MM* | GS | P.GS* | Degree† | Module |
|---|---|---|---|---|---|---|---|---|---|
| FAM30A | ENSG00000226777 | 0.75 | 3.63E-03 | 0.55 | 1.21E-04 | 0.42 | 4.81E-03 | 127 | greenyellow |
| NEAT1 | ENSG00000245532 | -1.63 | 7.64E-06 | 0.58 | 4.01E-05 | -0.60 | 1.48E-05 | 73 | lightcyan |
| MEG3 | ENSG00000214548 | -0.86 | 3.55E-05 | 0.53 | 2.36E-04 | -0.57 | 5.92E-05 | 49 | lightcyan |
| SND1-IT1 | ENSG00000279078 | -0.41 | 3.32E-03 | 0.28 | 6.39E-02 | -0.42 | 4.11E-03 | 49 | lightcyan |
| SNHG17 | ENSG00000196756 | -0.83 | 7.41E-06 | -0.54 | 1.45E-04 | -0.61 | 1.31E-05 | 5 | greenyellow |
| THAP9-AS1 | ENSG00000251022 | -0.58 | 3.28E-04 | -0.45 | 2.01E-03 | -0.51 | 4.63E-04 | 2 | greenyellow |
-
FC, the fold change of RA compared to healthy donors; GS, gene significance; MM, gene module membership. P.log2FC, P.GS, and P.MM represent the p-values of log2FC, MM, and GS, respectively.
-
*
Calculated by independent-samples t-test and adjusted by Benjamini and Hochberg method.
-
†
The degree or connectivity of hub long noncoding RNAs in corresponding module.
To further investigate their roles in RA, the regulation networks of lncRNAs were constructed, in which the lncRNA-related genes were subjected to the functional annotation. As shown in Figure 7a, a total of 66 genes were identified as the FAM30A-related genes in the greenyellow module, which were functionally involved in the module-related pathways mentioned above, such as primary immunodeficiency, T helper type 1 (Th1) and Th2 cell differentiation, and human T-cell leukaemia virus 1 infection, suggesting an indispensable role of FAM30A in the greenyellow module (Figure 7c). Moreover, the hub genes CD3D, IL2RG, and LCK were identified in the FAM30A-regulation network. In the lightcyan module, 44 NEAT1-related genes were identified and found to be involved in the adherent junction, parathyroid hormone, and mitogen-activated protein kinase (MAPK) pathways, among which FGFR1 showed the highest degree of the enriched pathways (Figures 7b and 7d). However, no lncRNAs were identified in the green module or turquoise module.
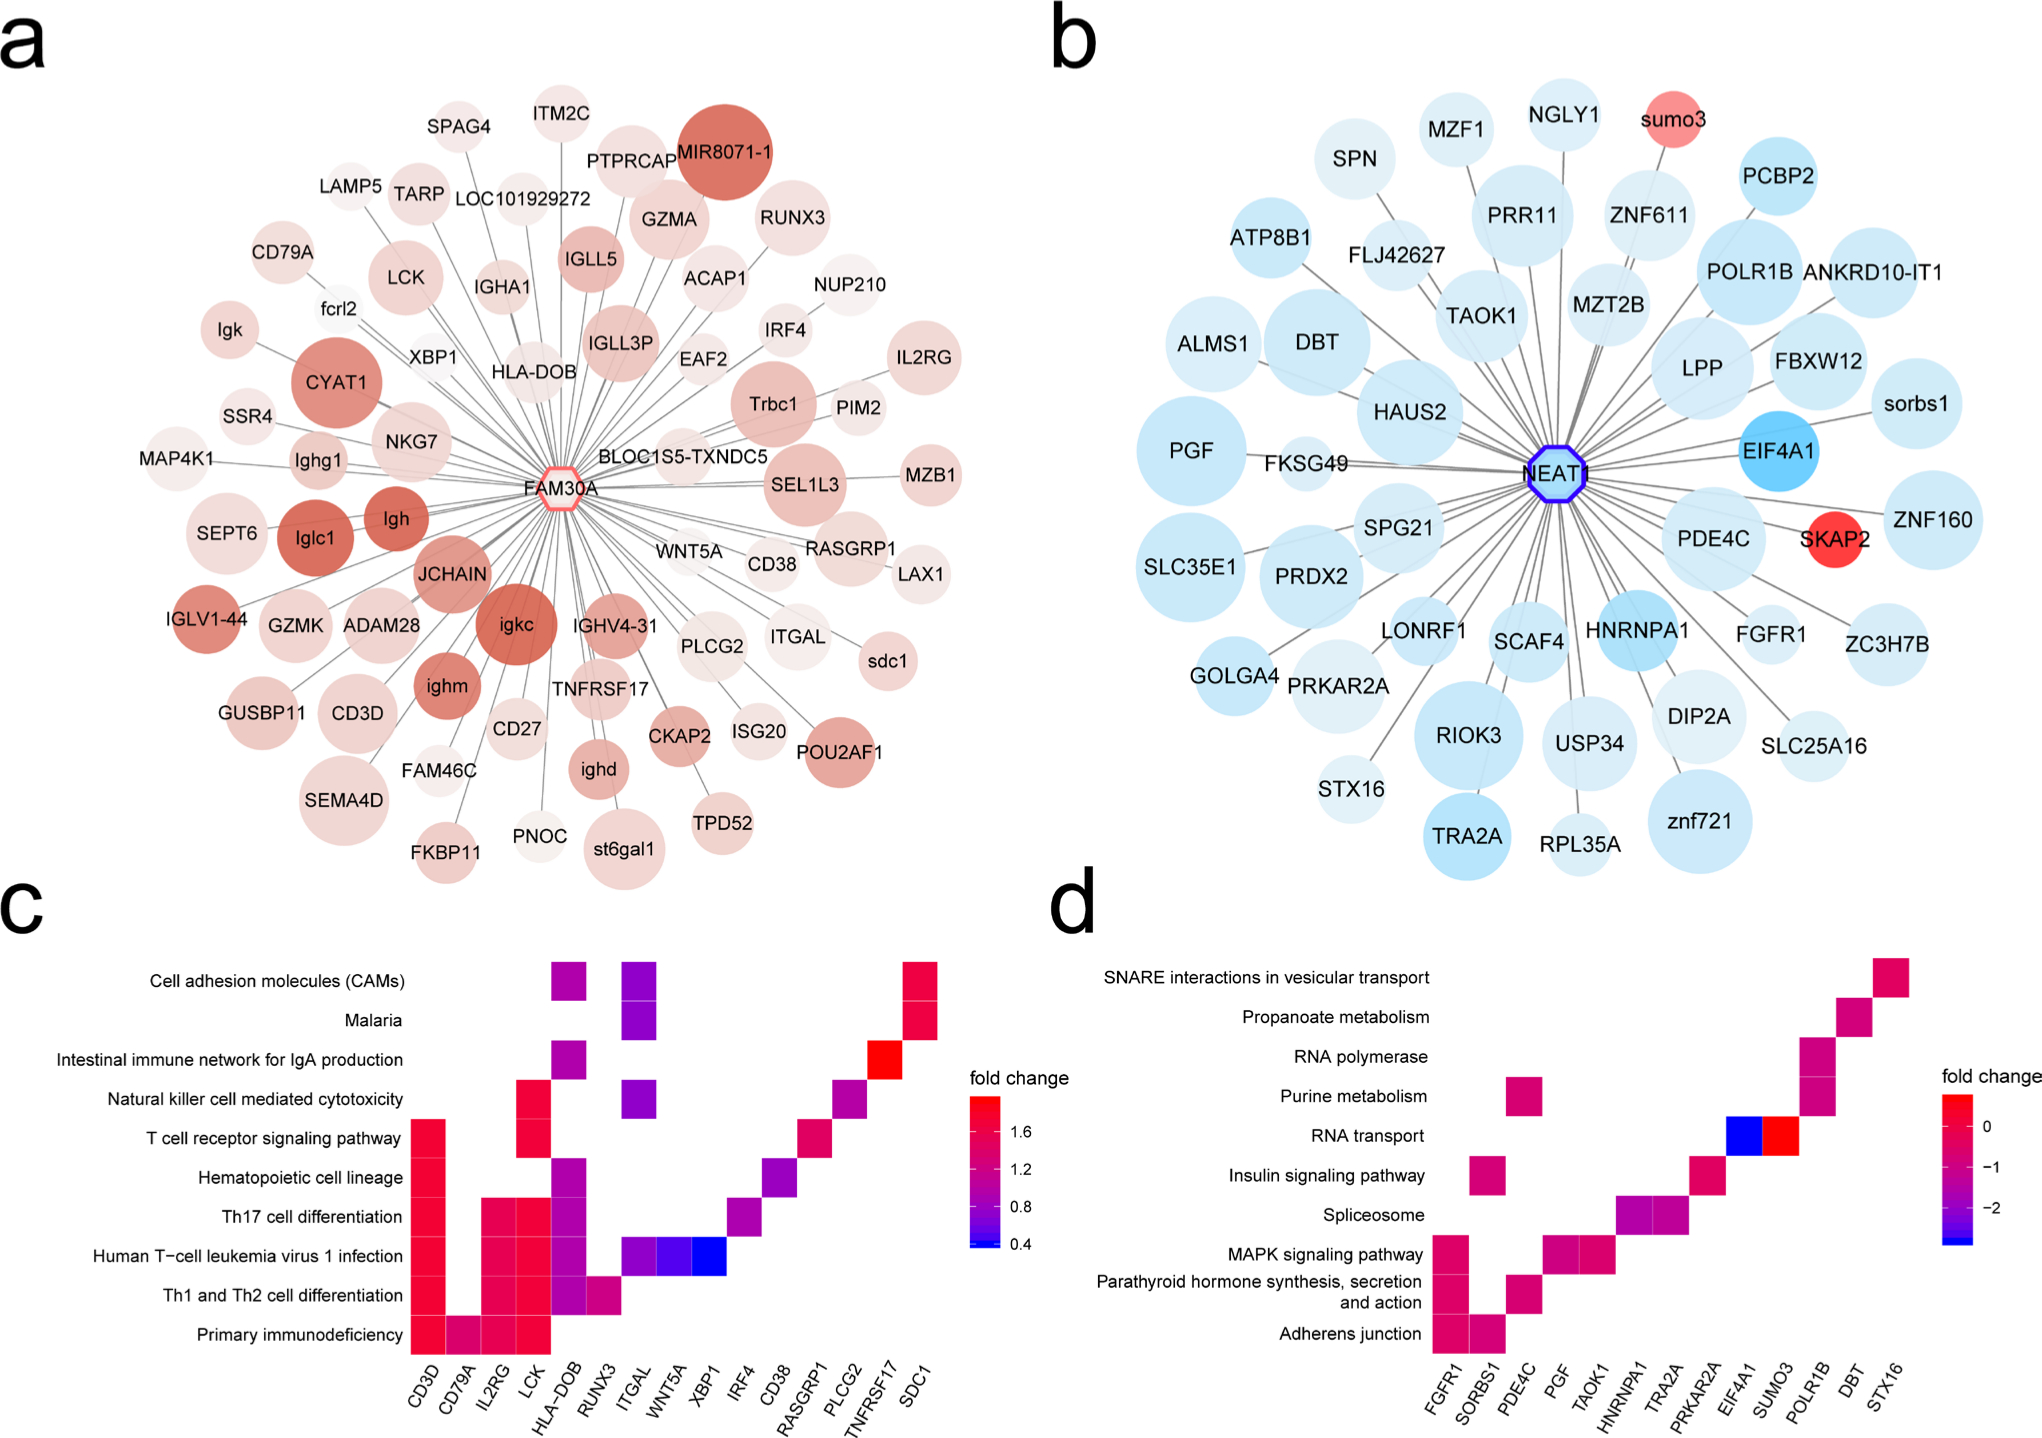
Fig. 7
Identification of hub long noncoding RNAs (lncRNAs) in rheumatoid arthritis (RA)-related modules. a) The co-expression regulation network of lncRNA FAM30A in greenyellow module. b) The co-expression regulation network of lncRNA NEAT1 in lightcyan module. c) Heatmap plot of enrich genes of Kyoto Encyclopedia of Genes and Genomes (KEGG) pathways in FAM30A-regulated network. (d) Heatmap plot of enrich genes of KEGG pathways in NEAT1-regulated network. IgA, immunoglobulin A; MAPK, mitogen-activated protein kinase; SNARE, SNAP REceptor; Th, T helper cell.
Compound screening based on RA-related modules
Using a pattern-matching algorithm, the CMap links compounds with disease or physiological phenotypes by measuring similarities in gene expression. To screen the potential therapeutic compounds with high specificity for RA, we mapped the gene expression signature of each module to CMap and constructed the relations of modules and compounds. As shown in Figure 8, 35, 47, 36, and 24 compounds were identified to target the green, greenyellow, lightcyan, and turquoise modules, respectively. To find the compounds targeting to as many modules as possible, we took the intersection of the compounds targeting the RA-related modules (Figure 8a). Moreover, we adjusted the enrichment scores of compounds by module-trait correlation coefficient and constructed the weighted compound-phenotype relations. The top 20 compounds in the rank of the MAS were identified as the potential therapeutic drugs with high specificity and broad coverage for the RA-related modules (Table III), among which niclosamide had the highest score of 2.01057. To assess the clinical value and mechanisms of niclosamide, we further investigated the compounds with similar signature to niclosamide, among which the top ten compounds in the rank of MES were clustered based on the expression signature in multiple types of cell, including A375 (human malignant melanoma), HA1E (human renal epithelial cell), HCC515 (human lung carcinoma), A549 (human non-small cell carcinoma), PC3 (human prostate adenocarcinoma), MCF7 (breast adenocarcinoma), and VCAP (prostate adenocarcinoma) (Figure 8b). Heliomycin harboured the most similar signature pattern with niclosamide among the multiple types of cells and IKK2-inhibitor-V harboured the highest MES. Compound categories were also investigated by clustering the compounds with the similar gene expression signature to niclosamide. As shown in Figure 7c, T-type calcium channel blocker (MES = 99.78, compound number = 5), IKK inhibitor (MES = 99.68, compound number = 3), PKC activator (MES = 99.74, compound number = 5), HIF activator (MES = 99.64, compound number = 4), and proteasome inhibitor (MES = 99.45, compound number = 3) were the top five categories in the rank of MES.
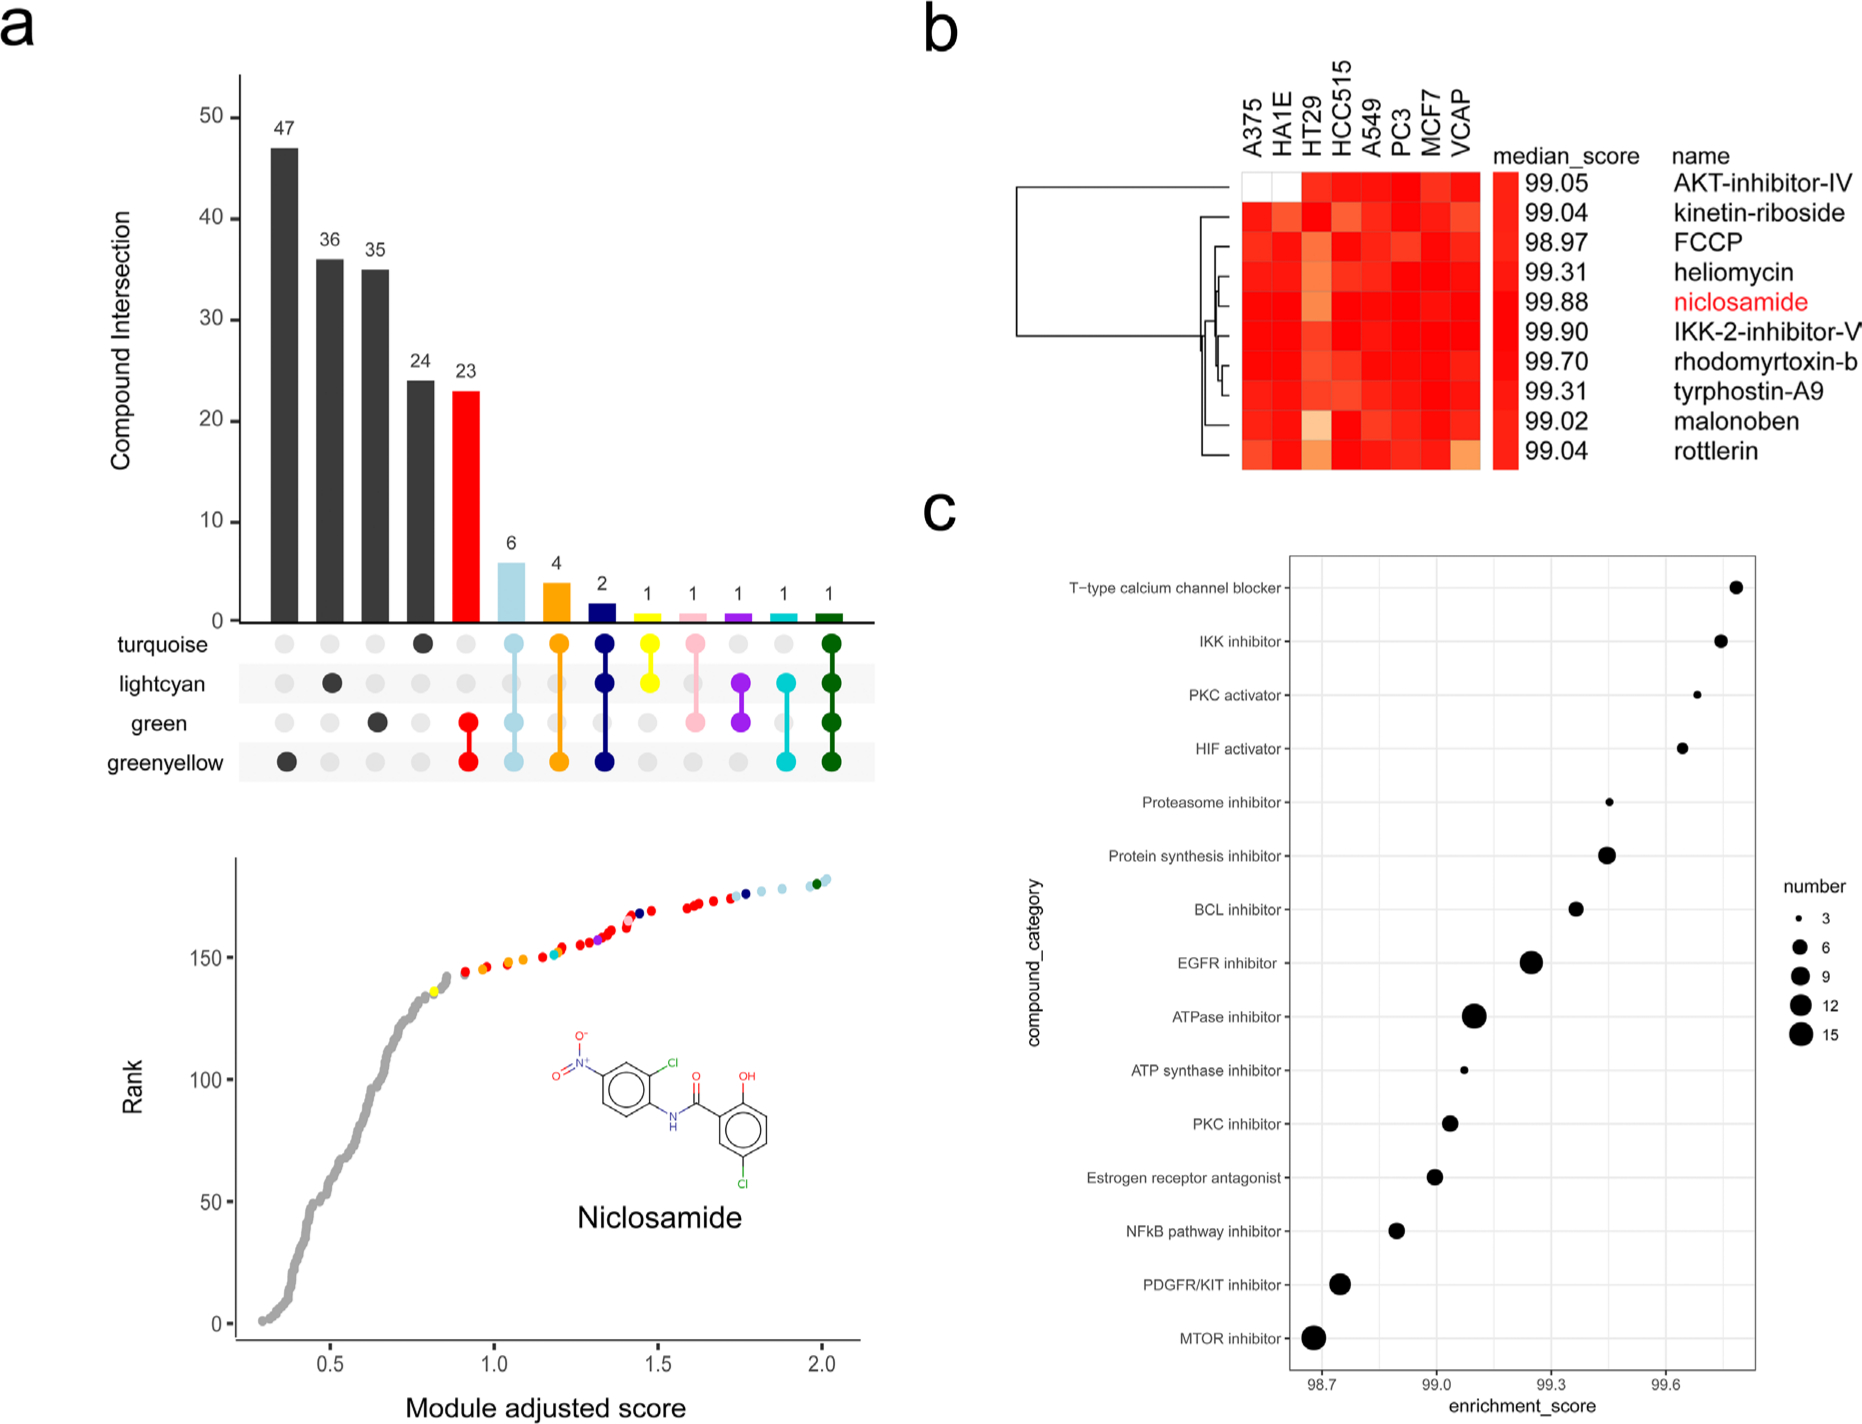
Fig. 8
Compound screening based on rheumatoid arthritis (RA)-related modules. a) Intersection of compounds targeting to specific RA-related modules and enrichment scores adjusted by module-trait correlation coefficient. b) Heatmap of gene expression signature of niclosamide and the compounds with similar signature. c) Compound categories with similar gene expression signature to niclosamide. EGFR, epidermal growth factor receptor; mTOR, mammalian target of rapamycin; NFκB, nuclear factor kappa-light-chain-enhancer of activated B cells; PDGFR, platelet-derived growth factor receptor; PKC, protein kinase C.
Table III.
Potential therapeutic compound screening based on module analysis.
| Compound | Module adjusted score* | Module number† | Rank‡ |
|---|---|---|---|
| Niclosamide | 2.01057 | 3 | 1 |
| Anisomycin | 2.00309 | 3 | 2 |
| Lanatoside C | 1.98056 | 4 | 3 |
| Lycorine | 1.95975 | 3 | 4 |
| Helveticoside | 1.87462 | 3 | 5 |
| Cephaeline | 1.81156 | 3 | 6 |
| Phenoxybenzamine | 1.76391 | 3 | 7 |
| Lomustine | 1.73451 | 3 | 8 |
| Thapsigargin | 1.71736 | 2 | 9 |
| 5,253,409 | 1.66515 | 2 | 10 |
| Ikarugamycin | 1.6206 | 2 | 11 |
| Proscillaridin | 1.60605 | 2 | 12 |
| Lasalocid | 1.58465 | 2 | 13 |
| Oxyphenbutazone | 1.476 | 2 | 14 |
| Digitoxigenin | 1.43979 | 3 | 15 |
| Prestwick-1082 | 1.41483 | 2 | 16 |
| Semustine | 1.40952 | 2 | 17 |
| STOCK1N-35696 | 1.40523 | 2 | 18 |
| Nomegestrol | 1.40221 | 2 | 19 |
| Hexetidine | 1.40123 | 2 | 20 |
-
*
Compound enrichment scores adjusted by module-trait correlation coefficient.
-
†
Targeted-module number of compounds.
-
‡
Rank of compounds according to the module adjusted scores.
Discussion
Rheumatoid arthritis is a systematic autoimmune disorder, the aetiology of which is still unclear. In this study, we performed WGCNA analysis based on the microarray datasets from a multicentre study including 33 RA patients and 20 healthy donors. Four significant RA-related modules were identified in our results, the functional annotation of which revealed the important pathways in RA.
The role of pathogens in the pathogenesis of RA is increasingly being recognized. Virus is identified as an important factor triggering autoimmunity in genetically susceptible patients and leading to diseases such as RA, Sjögren's syndrome, antiphospholipid syndrome, and systemic lupus erythematosus (SLE).20 The infection of human T-cell leukaemia virus type-1 or human T-lymphotropic virus type-1 (HTLV-1) was involved in the development of RA.21 HTLV-1-positive RA patients were subjected to higher inflammation and greater resistance to anti-TNF treatment.22 Büchel et al23 revealed a relationship between the influenza-A pathway and RA by an integrative pathway-based approach for genome-wide association studies (GWAS). Although no significant difference was determined for the serologic markers of herpes simplex viruses (HSV) in RA compared to the control group,24 HSV infection acts as a trigger of autoimmunity resulting in autoimmune diseases such as post-herpes simplex encephalitis, Guillain-Barré syndrome, and Bell’s palsy.24-26 Moreover, the enriched items such as Th17 cell differentiation, response to lipopolysaccharide and molecule of bacterial origin, and leishmaniasis revealed the indispensable role of bacteria in RA. Bacteria are also important pathogens in triggering autoimmunity. Th17 lineage cells, which function in the clearance of extracellular bacterial infections, play important roles in autoimmune disorders including inflammatory bowel disease and RA.27 Serum markers of RA, including rheumatoid factor and anti-cyclic citrullinated peptide antibody, were detected in visceral leishmaniasis,28 which may suggest the relevance between leishmaniasis and RA.
The role of immune disorders in RA has been widely recognized. Phagocytosis is an essential element of the immune response in the elimination of pathogens, cellular debris, apoptotic cells, and tumour cells.29 FcγR-mediated phagocytosis and lysosome were proven to be involved in four common autoimmune diseases, including Type 1 diabetes mellitus (T1D), multiple sclerosis (MS), SLE, and RA.30,31 The expression of FcγRI and FcγRII on monocytes was elevated in the RA patients compared with healthy controls,32 and FcγRIIA polymorphism contributes to the course of RA.33 The imbalance between activating and inhibitory FcγRs on macrophages, a deciding factor for the cellular response to immune complexes (ICs), is crucial in modulating the synovial inflammation.34 T and B lymphocytes also play a pathological role in the development and propagation of RA.35 B lymphocytes are recruited to the synovial fluid, where they contribute to local inflammation through the secretion of pro-inflammatory cytokines, the production of autoreactive pathogenic antibodies, and the antigen presentation for autoreactive T cells.
In this study, we recognized hub genes by two criterions, including the degrees in co-expression networks and the GS for RA. Almost all of the top 10% genes in the rank of degree show high GS. Given that we assumed the core hub gene should be functionally relevant in the module, we constructed the hub gene pathway networks and screened for the more critical cores among hundreds of hub genes. MHC Class II genes including HLA-DMA, HLA-DMB, HLA-DPA1, HLA-DPB1, HLA-DQB1, HLA-DRA, and HLA-DRB1 were identified as the core hubs in the green module. The HLA allele polymorphisms influenced the susceptibility to RA.36 High frequency expression of HLA-DPB1*0401 and *0601 were identified as the risk factors, however low frequency expression of DPB1*0101, *0402, and *0501 may be the protective factors for RA.37 Moreover, BLNK, BTK, CD3D, CD4, IL2RG, INPP5D, LCK, PTPRC, RAC2, SYK, and VAV1 were identified as the core hubs functionally relevant to the greenyellow module. Liubchenko et al38 showed that decreased phosphorylation of BLNK was associated with the loss of anergic B cell tolerance in RA. During B cell development and activation, BTK is involved in multiple signalling pathways downstream of the pre-B cell receptor (BCR) and Fc receptors (FcR), which is associated with RA.39 Chang et al40 found that IL2RG was differentially expressed in RA synovial tissues by RNA-sequencing. INPP5D was recognized as a negative regulator, which regulates interferon (IFN)-beta production downstream of toll-like receptor 3 (TLR3).41 Romagnoli et al42 showed a direct quantitative correlation between T cell hyporesponsiveness and modulation of LCK, a critical protein tyrosine kinase required for T cell activation. PTPRC rs10919563, a confirmed RA susceptibility locus, was the most replicated genetic biomarker of response to TNF inhibitors.43 Dey et al44 found that RAC2 was up-regulated consistently in the RA synovium and revealed the interplay between RAC2 and STAT1 in the regulation of nitric oxide. The phosphorylation of SYK in peripheral blood B cells was greatly elevated in RA, accompanied by strong anti-citrullinated protein antibody (ACPA) positivity.45 Guerreiro-Cacais et al46 addressed the role of VAV1 in RA pathogenesis in experimental models and the patients of anti-cyclic citrullinated peptide (CCP)-negative RA.
In recent years, noncoding RNAs (ncRNAs) such as microRNAs (miRNAs) and lncRNAs are recognized as the emerging players in diverse biological processes and diseases including arthritis.47,48FAM30A showed its crucial role in the function of some immune cells, such as Th1, Th2, Th17, and natural killer cells (NK cells). Moreover, CD3D, IL2RG, LCK, and HLA-DOB presented high functional connectivity with FAM30A, among which CD3D, IL2RG, and LCK are the core hub genes we identified. NEAT1-related hub genes were mainly involved in the MAPK pathway, among which FGFR1 showed high functional connectivity with NEAT1. Zhang et al49 identified the role of NEAT1 in the TLR4-mediated inflammatory process, which affected the activation of the MAPK signalling pathway. Some studies50–52 have indicated the roles of FGFR1 in RA,53 however the relationship between FGFR1 and NEAT1 has not been confirmed.
Given that some respond little to the RA pharmacological treatment and suffer from severe side effects,1 we developed a novel algorithm based on modules to screen the promising drugs. In our study, we identified the drugs harbouring the opposite gene expression signature of RA-related modules and ranked them by the MAS, which ensures the high specificity and broad coverage for RA. Niclosamide, which had the highest MAS, was proven to be effective in the treatment of RA.54 In an eight-week randomized controlled pilot study, Al-Gareeb et al55 found that niclosamide was an adjuvant to etanercept for the Iraqi patients of active RA and greatly improved life quality, reduced the clinical assessment scoring indices, and decreased the serum level of IL-1β, E-selectin, vascular cell adhesion molecule 1 (VCAM1), and intercellular adhesion molecule 1 (ICAM1).55 Niclosamide reduced the secretion of multiple cytokines from TNF-α-induced human RA fibroblast-like synoviocytes (FLS) and inhibited the migration and invasion of FLS by suppressing F-actin alterations. Moreover, niclosamide suppressed MAPK and nuclear factor kappa-light-chain-enhancer of activated B cells (NF-κB) pathway activity in FLS. The treatment effect was also confirmed in the collagen-induced arthritis mouse model.56 Huang et al57 confirmed that niclosamide induced mitochondrial apoptosis and inhibited proliferation of human RA fibroblast-like synoviocytes via the Akt signalling pathway.57 Still, more clinical evidence and mechanism research is needed in future. Due to the variance of genetic background among ethnicities, the response to niclosamide should be considered among different ethnicities. In addition to oral administration, other types of drug delivery should be a valuable direction, such as intra-articular injection which may reduce the effective amount. Given that we constructed the mapping of niclosamide and modules, it is valuable to investigate the regulation between niclosamide and those hub genes in the modules, such as BTK and LCK, to reveal underlying molecular mechanisms.
In conclusion, we constructed a WGCNA to identify the significant RA-related modules and potential targets, the functional annotation of which revealed their indispensable roles in RA. To screen the promising drugs for RA, we developed a module-based and cumulatively scoring approach which ensured high specificity and broad coverage of RA-related modules. Our study provides not only the promising targets and drugs for RA but also a novel methodological insight into the potential target and drug screening.
References
1. Burmester GR , Pope JE . Novel treatment strategies in rheumatoid arthritis . Lancet . 2017 ; 389 ( 10086 ): 2338 – 2348 . Crossref PubMed Google Scholar
2. Korani S , Korani M , Butler AE , Sahebkar A . Genetics and rheumatoid arthritis susceptibility in Iran . J Cell Physiol . 2019 ; 234 ( 5 ): 5578 – 5587 . Crossref PubMed Google Scholar
3. Simon TA , Thompson A , Gandhi KK , Hochberg MC , Suissa S . Incidence of malignancy in adult patients with rheumatoid arthritis: a meta-analysis . Arthritis Res Ther . 2015 ; 17 : 212 . Crossref PubMed Google Scholar
4. Hoovestol RA , Mikuls TR . Environmental exposures and rheumatoid arthritis risk . Curr Rheumatol Rep . 2011 ; 13 ( 5 ): 431 – 439 . Crossref PubMed Google Scholar
5. Eyre S , Bowes J , Diogo D , et al. High-Density genetic mapping identifies new susceptibility loci for rheumatoid arthritis . Nat Genet . 2012 ; 44 ( 12 ): 1336 – 1340 . Crossref PubMed Google Scholar
6. Sardar S , Andersson A . Old and new therapeutics for rheumatoid arthritis: in vivo models and drug development . Immunopharmacol Immunotoxicol . 2016 ; 38 ( 1 ): 2 – 13 . Crossref PubMed Google Scholar
7. Woetzel D , Huber R , Kupfer P , et al. Identification of rheumatoid arthritis and osteoarthritis patients by transcriptome-based rule set generation . Arthritis Res Ther . 2014 ; 16 ( 2 ): R84 . Crossref PubMed Google Scholar
8. Chen YJ , Chang WA , Wu LY , et al. Systematic analysis of differential expression profile in rheumatoid arthritis chondrocytes using next-generation sequencing and bioinformatics approaches . Int J Med Sci . 2018 ; 15 ( 11 ): 1129 – 1142 . Crossref PubMed Google Scholar
9. Li WC , Bai DL , Xu Y , et al. Identification of differentially expressed genes in synovial tissue of rheumatoid arthritis and osteoarthritis in patients . J Cell Biochem . 2019 ; 120 ( 3 ): 4533-4544 . Crossref PubMed Google Scholar
10. Panga V , Raghunathan S . A cytokine protein-protein interaction network for identifying key molecules in rheumatoid arthritis . PLoS One . 2018 ; 13 ( 6 ): e0199530 . Crossref PubMed Google Scholar
11. Langfelder P , Horvath S . WGCNA: an R package for weighted correlation network analysis . BMC Bioinformatics . 2008 ; 9 : 559 . Crossref PubMed Google Scholar
12. Ma C , Lv Q , Teng S , et al. Identifying key genes in rheumatoid arthritis by weighted gene co-expression network analysis . Int J Rheum Dis . 2017 ; 20 ( 8 ): 971 – 979 . Crossref PubMed Google Scholar
13. Lamb J , Crawford ED , Peck D , et al. The connectivity map: using gene-expression signatures to connect small molecules, genes, and disease . Science . 2006 ; 313 ( 5795 ): 1929 – 1935 . Crossref PubMed Google Scholar
14. Qu XA , Rajpal DK . Applications of connectivity map in drug discovery and development . Drug Discov Today . 2012 ; 17 ( 23-24 ): 1289 – 1298 . Crossref PubMed Google Scholar
15. Subramanian A , Narayan R , Corsello SM , et al. A next generation connectivity map: L1000 platform and the first 1,000,000 profiles . Cell . 2017 ; 171 ( 6 ): 1437 – 1452 . Crossref PubMed Google Scholar
16. Joerger M , Baty F , Früh M , et al. Circulating microRNA profiling in patients with advanced non-squamous NSCLC receiving bevacizumab/erlotinib followed by platinum-based chemotherapy at progression (SAKK 19/05) . Lung Cancer . 2014 ; 85 ( 2 ): 306 – 313 . Crossref PubMed Google Scholar
17. Papiez A , Marczyk M , Polanska J , Polanski A . BatchI: batch effect identification in high-throughput screening data using a dynamic programming algorithm . Bioinformatics . 2019 ; 35 ( 11 ): 1885 – 1892 . Crossref PubMed Google Scholar
18. Yu G , Wang LG , Han Y , He QY . clusterProfiler: an R package for comparing biological themes among gene clusters . OMICS . 2012 ; 16 ( 5 ): 284 – 287 . Crossref PubMed Google Scholar
19. Fang S , Zhang L , Guo J , et al. NONCODEV5: a comprehensive annotation database for long non-coding RNAs . Nucleic Acids Res . 2018 ; 46 ( D1 ): D308 – D314 . Crossref PubMed Google Scholar
20. Mathew AJ , Ravindran V . Infections and arthritis . Best Pract Res Clin Rheumatol . 2014 ; 28 ( 6 ): 935 – 959 . Google Scholar
21. Quaresma JAS , Yoshikawa GT , Koyama RVL , et al. HTLV-1, immune response and autoimmunity . Viruses . 2015 ; 8 ( 1 ): 5 . Crossref PubMed Google Scholar
22. Umekita K , Hidaka T , Miyauchi S , et al. Treatment with anti–tumor necrosis factor biologic agents in human T lymphotropic virus type I–positive patients with rheumatoid arthritis . Arthritis Care Res (Hoboken) . 2014 ; 66 ( 5 ): 788 – 792 . Crossref PubMed Google Scholar
23. Büchel F , Mittag F , Wrzodek C , et al. Integrative pathway-based approach for genome-wide association studies: identification of new pathways for rheumatoid arthritis and type 1 diabetes . PLoS One . 2013 ; 8 ( 10 ): e78577 . Crossref PubMed Google Scholar
24. Us T , Cetin E , Kaşifoğlu N , Kaşifoğlu T , Akgün Y . Investigation of Epstein-Barr virus and herpes simplex virus markers by serological and molecular methods in patients with rheumatoid arthritis and systemic lupus erythematosus . Mikrobiyol Bul . 2011 ; 45 ( 4 ): 677 – 683 . (Article in Turkish) . Google Scholar
25. Armangue T , Leypoldt F , Málaga I , et al. Herpes simplex virus encephalitis is a trigger of brain autoimmunity . Ann Neurol . 2014 ; 75 ( 2 ): 317 – 323 . Crossref PubMed Google Scholar
26. Greco A , Gallo A , Fusconi M , et al. Bell's palsy and autoimmunity . Autoimmun Rev . 2012 ; 12 ( 2 ): 323 – 328 . Crossref PubMed Google Scholar
27. Bedoya SK , Lam B , Lau K , Larkin J . Th17 cells in immunity and autoimmunity . Clin Dev Immunol . 2013 ; 2013 : 986789. : 1 – 16 . Crossref PubMed Google Scholar
28. Atta AM , Carvalho EM , Jerônimo SMB , Sousa Atta MLB . Serum markers of rheumatoid arthritis in visceral leishmaniasis: rheumatoid factor and anti-cyclic citrullinated peptide antibody . J Autoimmun . 2007 ; 28 ( 1 ): 55 – 58 . Crossref PubMed Google Scholar
29. Corrotte M , Nyguyen APT , Harlay ML , et al. Ral isoforms are implicated in Fc gamma R-mediated phagocytosis: activation of phospholipase D by RalA . J Immunol . 2010 ; 185 ( 5 ): 2942 – 2950 . Crossref PubMed Google Scholar
30. Zhang M , Mu H , Lv H , et al. Integrative analysis of genome-wide association studies and gene expression analysis identifies pathways associated with rheumatoid arthritis . Oncotarget . 2016 ; 7 ( 8 ): 8580 – 8589 . Crossref PubMed Google Scholar
31. Luan M , Shang Z , Teng Y , et al. The shared and specific mechanism of four autoimmune diseases . Oncotarget . 2017 ; 8 ( 65 ): 108355 – 108374 . Crossref PubMed Google Scholar
32. Torsteinsdóttir I , Arvidson NG , Hällgren R , Håkansson L . Monocyte activation in rheumatoid arthritis (rA): increased integrin, Fc gamma and complement receptor expression and the effect of glucocorticoids . Clin Exp Immunol . 1999 ; 115 ( 3 ): 554 – 560 . Crossref PubMed Google Scholar
33. Brun JG , Madland TM , Vedeler CA . Immunoglobulin G Fc-receptor (FcgammaR) IIA, IIIa, and IIIB polymorphisms related to disease severity in rheumatoid arthritis . J Rheumatol . 2002 ; 29 ( 6 ): 1135 – 1140 . PubMed Google Scholar
34. Santegoets KCM , Wenink MH , van den Berg WB , Radstake TRDJ . Fc gamma receptor IIb on GM-CSF macrophages controls immune complex mediated inhibition of inflammatory signals . PLoS One . 2014 ; 9 ( 10 ): e110966 . Crossref PubMed Google Scholar
35. Glossop JR , Emes RD , Nixon NB , et al. Genome-wide DNA methylation profiling in rheumatoid arthritis identifies disease-associated methylation changes that are distinct to individual T- and B-lymphocyte populations . Epigenetics . 2014 ; 9 ( 9 ): 1228 – 1237 . Crossref PubMed Google Scholar
36. Mariaselvam CM , Fortier C , Charron D , et al. HLA class II alleles influence rheumatoid arthritis susceptibility and autoantibody status in South Indian Tamil population . HLA . 2016 ; 88 ( 5 ): 253 – 258 . Crossref PubMed Google Scholar
37. Jiang L , Jiang D , Han Y , Shi X , Ren C . Association of HLA-DPB1 polymorphisms with rheumatoid arthritis: A systemic review and meta-analysis . Int J Surg . 2018 ; 52 : 98 – 104 . Crossref PubMed Google Scholar
38. Liubchenko GA , Appleberry HC , Striebich CC , et al. Rheumatoid arthritis is associated with signaling alterations in naturally occurring autoreactive B-lymphocytes . J Autoimmun . 2013 ; 40 : 111 – 121 . Crossref PubMed Google Scholar
39. Whang JA , Chang BY . Bruton's tyrosine kinase inhibitors for the treatment of rheumatoid arthritis . Drug Discov Today . 2014 ; 19 ( 8 ): 1200 – 1204 . Crossref PubMed Google Scholar
40. Chang X , Yue L , Liu W , et al. CD38 and E2F transcription factor 2 have uniquely increased expression in rheumatoid arthritis synovial tissues . Clin Exp Immunol . 2014 ; 176 ( 2 ): 222 – 231 . Crossref PubMed Google Scholar
41. Gabhann JN , Higgs R , Brennan K , et al. Absence of SHIP-1 results in constitutive phosphorylation of tank-binding kinase 1 and enhanced TLR3-dependent IFN-beta production . J Immunol . 2010 ; 184 ( 5 ): 2314 – 2320 . Crossref PubMed Google Scholar
42. Romagnoli P , Strahan D , Pelosi M , Cantagrel A , van Meerwijk JP . A potential role for protein tyrosine kinase p56(lck) in rheumatoid arthritis synovial fluid T lymphocyte hyporesponsiveness . Int Immunol . 2001 ; 13 ( 3 ): 305 – 312 . Crossref PubMed Google Scholar
43. Ferreiro-Iglesias A , Montes A , Perez-Pampin E , et al. Replication of PTPRC as genetic biomarker of response to TNF inhibitors in patients with rheumatoid arthritis . Pharmacogenomics J . 2016 ; 16 ( 2 ): 137 – 140 . Crossref PubMed Google Scholar
44. Dey P , Panga V , Raghunathan S . A cytokine signalling network for the regulation of inducible nitric Oxide synthase expression in rheumatoid arthritis . PLoS One . 2016 ; 11 ( 9 ): e0161306 . Crossref PubMed Google Scholar
45. Iwata S , Nakayamada S , Fukuyo S , et al. Activation of Syk in peripheral blood B cells in patients with rheumatoid arthritis: a potential target for abatacept therapy . Arthritis Rheumatol . 2015 ; 67 ( 1 ): 63 – 73 . Crossref PubMed Google Scholar
46. Guerreiro-Cacais AO , Norin U , Gyllenberg A , et al. VAV1 regulates experimental autoimmune arthritis and is associated with anti-CCP negative rheumatoid arthritis . Genes Immun . 2017 ; 18 ( 1 ): 48 – 56 . Crossref PubMed Google Scholar
47. Yin CM , Suen WC , Lin S , et al. Dysregulation of both miR-140-3p and miR-140-5p in synovial fluid correlate with osteoarthritis severity . Bone Joint Res . 2017 ; 6 ( 11 ): 612 – 618 . Crossref PubMed Google Scholar
48. Li H , Yang HH , Sun ZG , Tang HB , Min JK . Whole-transcriptome sequencing of knee joint cartilage from osteoarthritis patients . Bone Joint Res . 2019 ; 8 ( 7 ): 290 – 303 . Crossref PubMed Google Scholar
49. Zhang F , Wu L , Qian J , et al. Identification of the long noncoding RNA NEAT1 as a novel inflammatory regulator acting through MAPK pathway in human lupus . J Autoimmun . 2016 ; 75 : 96 – 104 . Crossref PubMed Google Scholar
50. Byrd V , Zhao XM , McKeehan WL , Miller GG , Thomas JW . Expression and functional expansion of fibroblast growth factor receptor T cells in rheumatoid synovium and peripheral blood of patients with rheumatoid arthritis . Arthritis Rheum . 1996 ; 39 ( 6 ): 914 – 922 . Crossref PubMed Google Scholar
51. Zhang L , Li W , Song L , Chen L . A towards-multidimensional screening approach to predict candidate genes of rheumatoid arthritis based on SNP, structural and functional annotations . BMC Med Genomics . 2010 ; 3 ( 1 ): 38 . Crossref PubMed Google Scholar
52. Qin S , Sun D , Li H , et al. The Effect of SHH-Gli Signaling Pathway on the Synovial Fibroblast Proliferation in Rheumatoid Arthritis . Inflammation . 2016 ; 39 ( 2 ): 503 – 512 . Crossref PubMed Google Scholar
53. Tan Q , Chen B , Wang Q , et al. A novel FGFR1-binding peptide attenuates the degeneration of articular cartilage in adult mice . Osteoarthritis Cartilage . 2018 ; 26 ( 12 ): 1733 – 1743 . Crossref PubMed Google Scholar
54. Chen W , Mook RA , Premont RT , Wang J . Niclosamide: Beyond an antihelminthic drug . Cell Signal . 2018 ; 41 : 89 – 96 . Crossref PubMed Google Scholar
55. Al-Gareeb AIA , Gorial FI , Mahmood AS . Niclosamide as an adjuvant to etanercept in treatment patients with active rheumatoid arthritis: an 8-week randomized controlled pilot study . Clin Rheumatol . 2018 ; 37 ( 10 ): 2633 – 2641 . Crossref PubMed Google Scholar
56. Liang L , Huang M , Xiao Y , et al. Inhibitory effects of niclosamide on inflammation and migration of fibroblast-like synoviocytes from patients with rheumatoid arthritis . Inflamm Res . 2015 ; 64 ( 3-4 ): 225 – 233 . Crossref PubMed Google Scholar
57. Huang M , Zeng S , Qiu Q , et al. Niclosamide induces apoptosis in human rheumatoid arthritis fibroblast-like synoviocytes . Int Immunopharmacol . 2016 ; 31 : 45 – 49 . Crossref PubMed Google Scholar
Author contributions
X. Li: Wrote and revised the manuscript.
Y. Yang: Wrote the manuscript.
G. Sun: Analyzed the data.
W. Dai: Analyzed the data.
X. Jie: Analyzed the data.
Y. Du: Analyzed the data.
R. Huang: Analyzed the data.
J. Zhang: Designed the study, Analyzed the data, Gave the final approval of the manuscript.
X. Li and Y. Yang contributed equally to this work.
Funding statement
This study was supported by National Natural Science Foundation of China (Grant No. 81760389). No benefits in any form have been received or will be received from a commercial party related directly or indirectly to the subject of this article.
ICMJE COI statement
The authors declared no conflict of interests about the publication of this paper.
Acknowledgements
This study was supported by the National Natural Science Foundation of China (Grant No. 81760389).
Supplementary material
Figure showing a dendrogram of the hierarchical clustering in the study, and table showing clinical features of the patients and healthy donors included.
© 2020 Author(s) et al. This is an open-access article distributed under the terms of the Creative Commons Attribution Non-Commercial No Derivatives (CC BY-NC-ND 4.0) licence, which permits the copying and redistribution of the work only, and provided the original author and source are credited. See https://creativecommons.org/licenses/by-nc-nd/4.0/.